Canada Goose Investor Day Presentation Deck
$ Revenue
DTC%
Adjusted EBITDA¹
Adjusted EBITDA Margin¹
Adjusted Net Income
Pricing CAGR
Volume Units CAGR
Retail Stores
E-commerce Markets
CANADA GOOSE
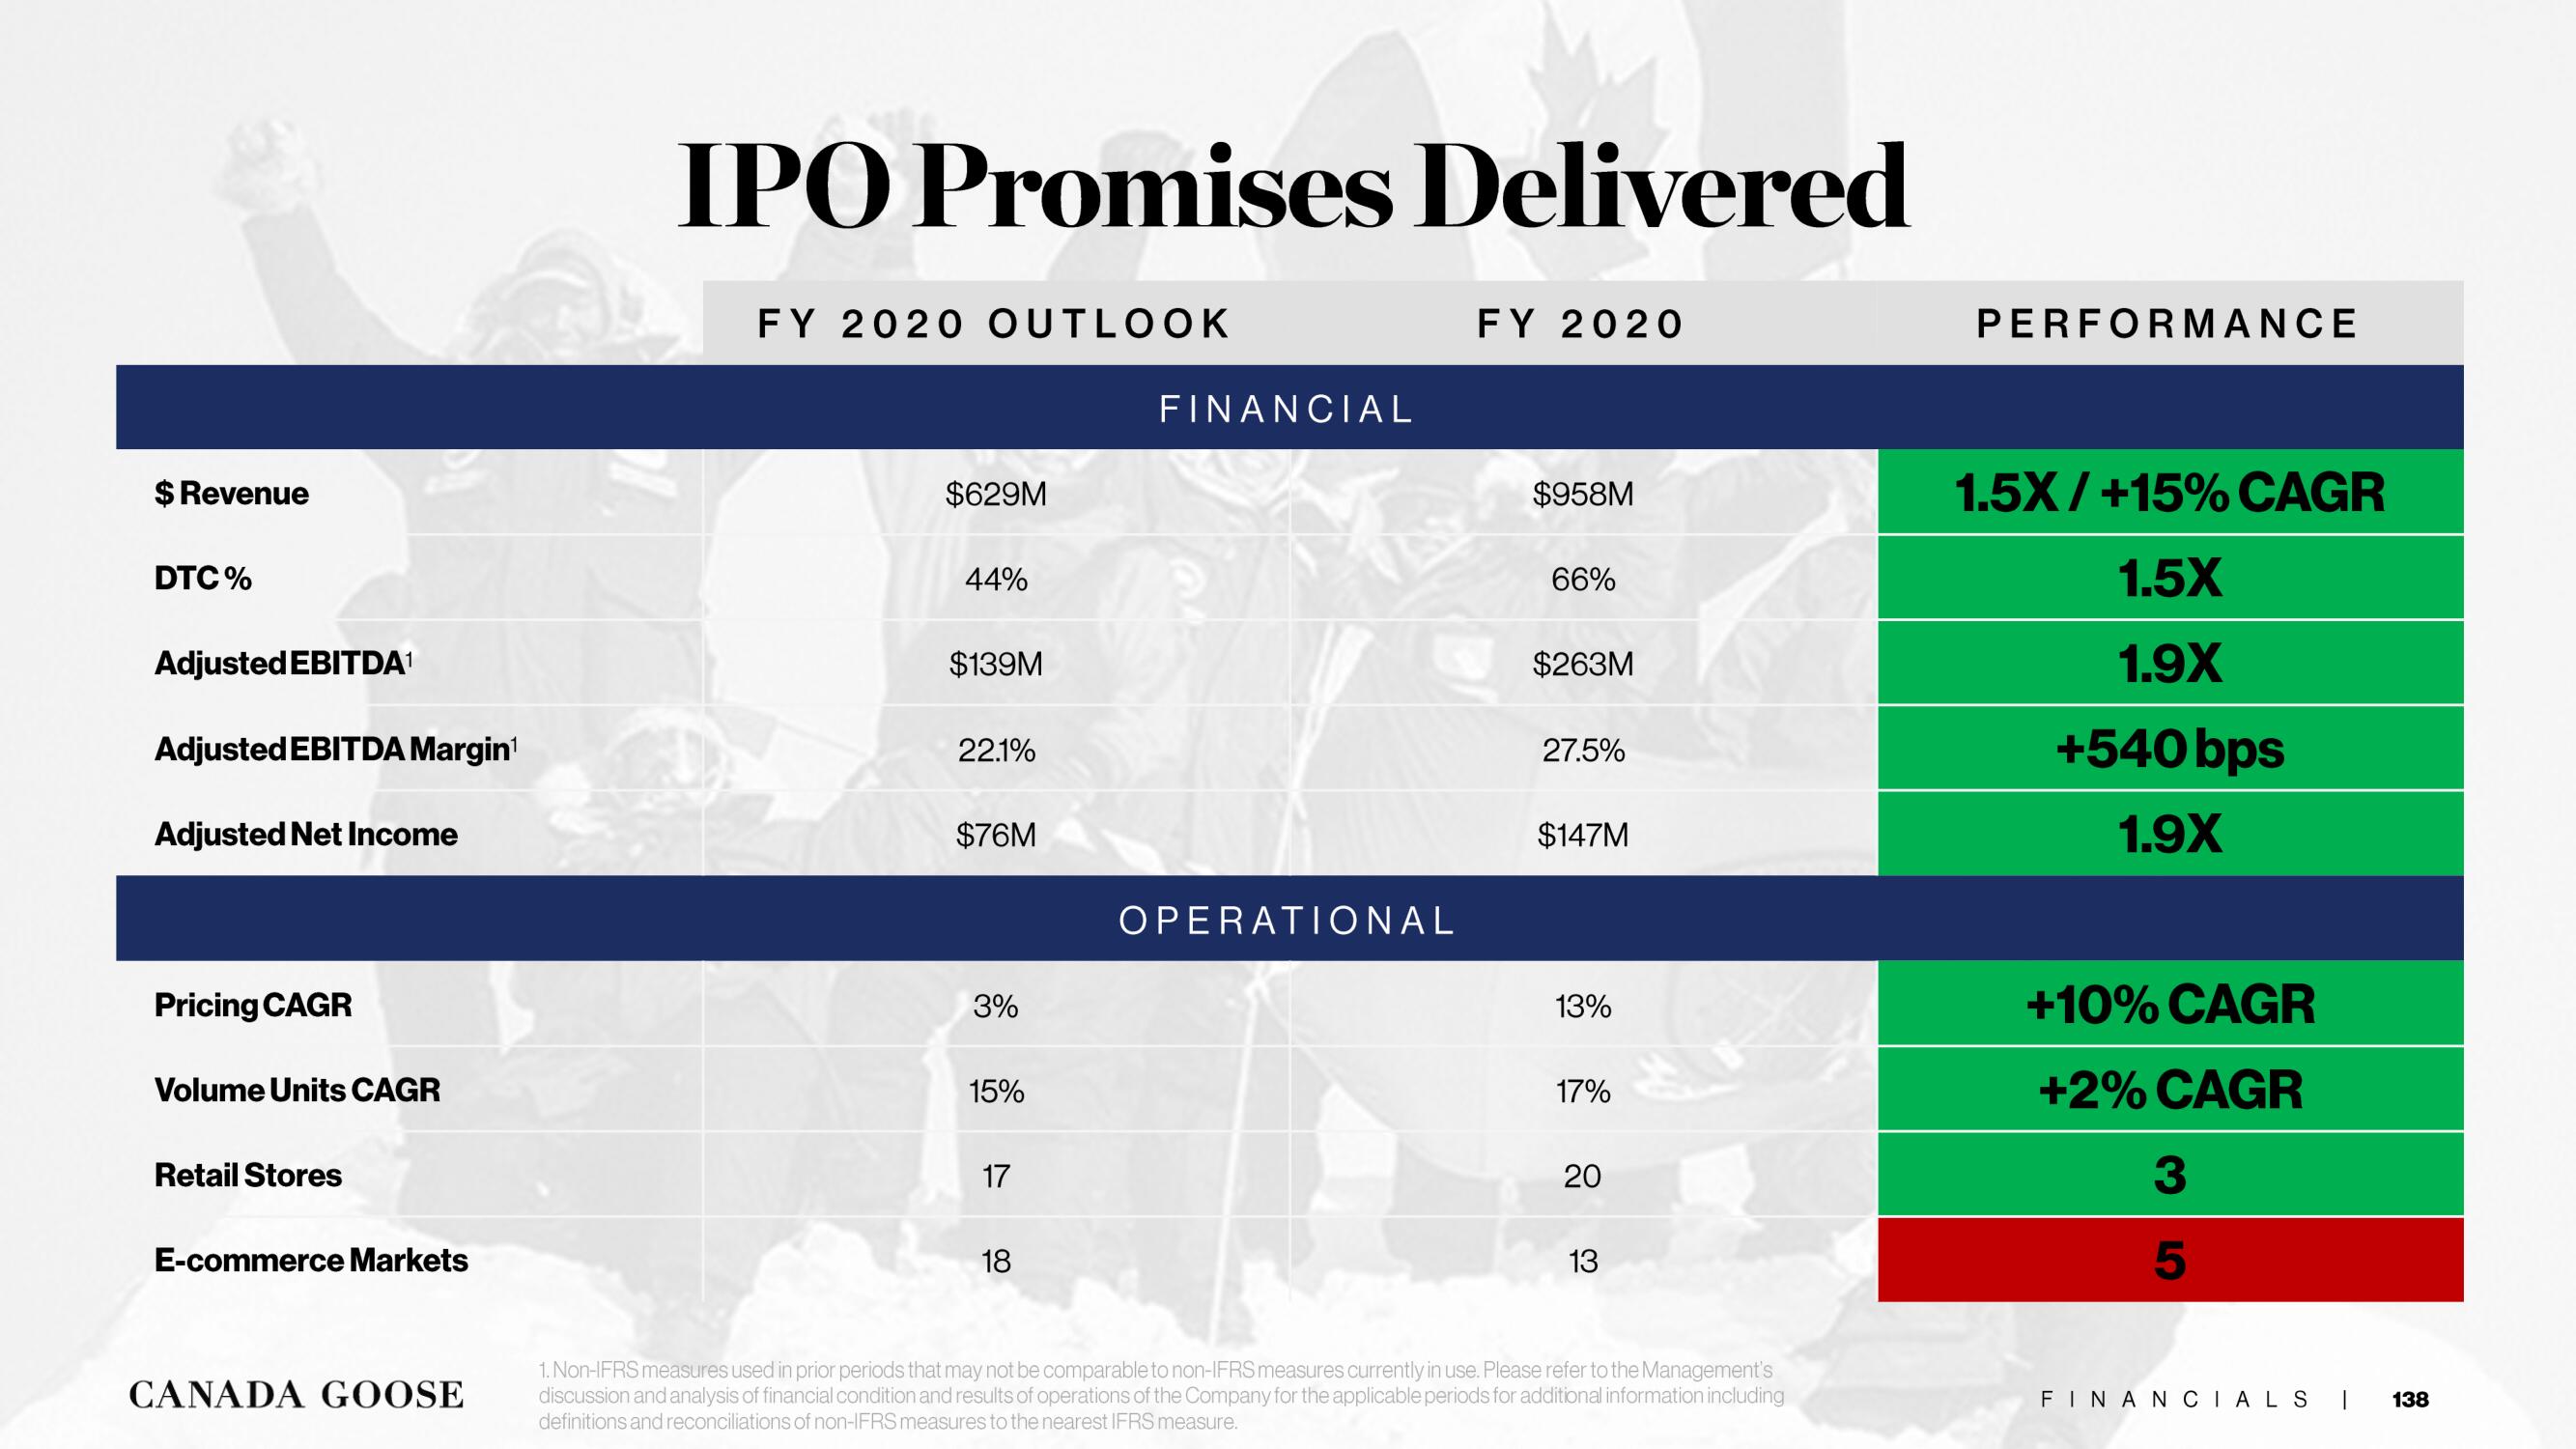
IPO Promises Delivered
FY 2020 OUTLOOK
$629M
44%
$139M
22.1%
$76M
3%
15%
17
18
FINANCIAL
OPERATIONAL
FY 2020
$958M
66%
$263M
27.5%
$147M
13%
17%
20
13
1. Non-IFRS measures used in prior periods that may not be comparable to non-IFRS measures currently in use. Please refer to the Management's
discussion and analysis of financial condition and results of operations of the Company for the applicable periods for additional information including
definitions and reconciliations of non-IFRS measures to the nearest IFRS measure.
PERFORMANCE
1.5X/+15% CAGR
1.5X
1.9X
+540 bps
1.9X
+10% CAGR
+2% CAGR
3
5
FINANCIALS I
138View entire presentation