Ginkgo Investor Conference Presentation Deck
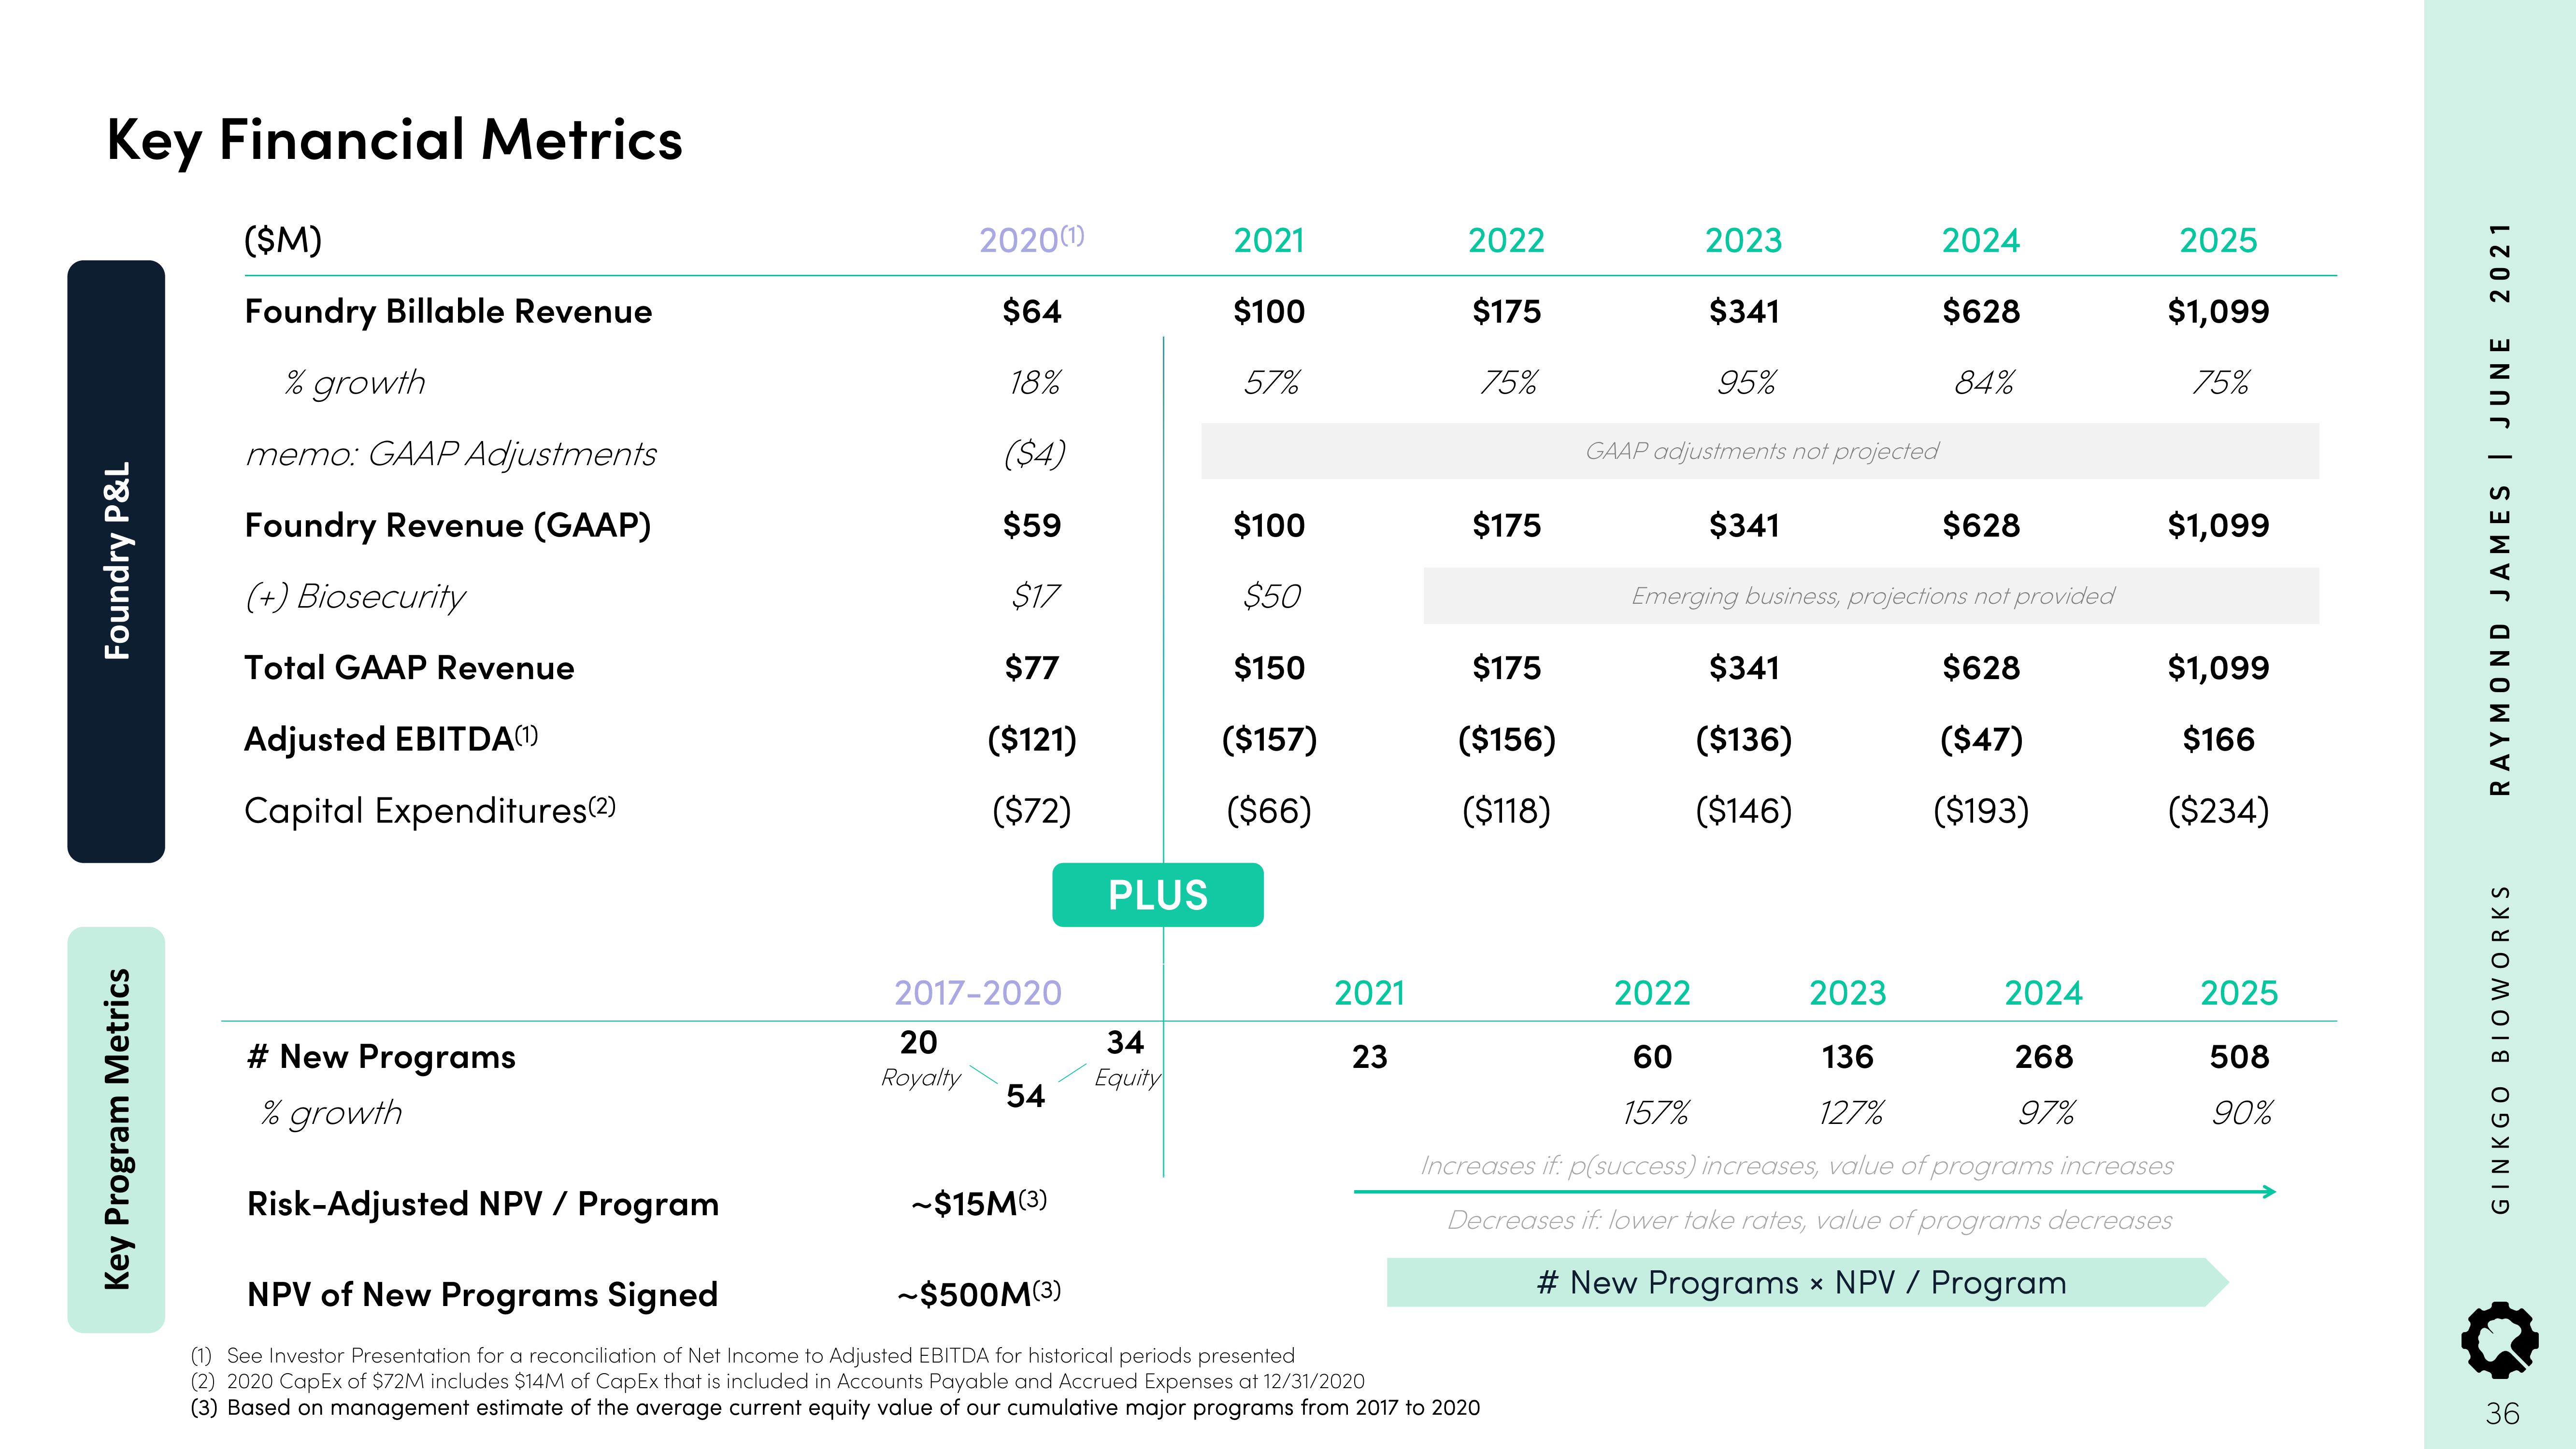
Key Financial Metrics
Foundry P&L
Key Program Metrics
($M)
Foundry Billable Revenue
% growth
memo: GAAP Adjustments
Foundry Revenue (GAAP)
(+) Biosecurity
Total GAAP Revenue
Adjusted EBITDA(1)
Capital Expenditures(2)
2020(1)
$64
18%
($4)
$59
$17
$77
($121)
($72)
2017-2020
20
Royalty
54
~$15M(3)
PLUS
~$500M(3)
34
Equity
2021
$100
57%
$100
$50
$150
($157)
($66)
2021
23
2022
$175
75%
$175
# New Programs
% growth
Risk-Adjusted NPV / Program
NPV of New Programs Signed
(1) See Investor Presentation for a reconciliation of Net Income to Adjusted EBITDA for historical periods presented
(2) 2020 CapEx of $72M includes $14M of CapEx that is included in Accounts Payable and Accrued Expenses at 12/31/2020
(3) Based on management estimate of the average current equity value of our cumulative major programs from 2017 to 2020
$175
($156)
($118)
2023
$341
95%
GAAP adjustments not projected
$341
2024
$628
84%
$628
Emerging business, projections not provided
$628
($47)
($193)
$341
($136)
($146)
2022
60
157%
2025
2024
268
97%
$1,099
75%
2023
136
127%
Increases if: p(success) increases, value of programs increases
Decreases if: lower take rates, value of programs decreases
# New Programs x NPV / Program
$1,099
$1,099
$166
($234)
2025
508
90%
2021
RAYMOND JAMES | JUNE
GINKGO BIOWORKS
36View entire presentation