J.P.Morgan 2Q23 Investor Results
JPMORGAN CHASE & CO.
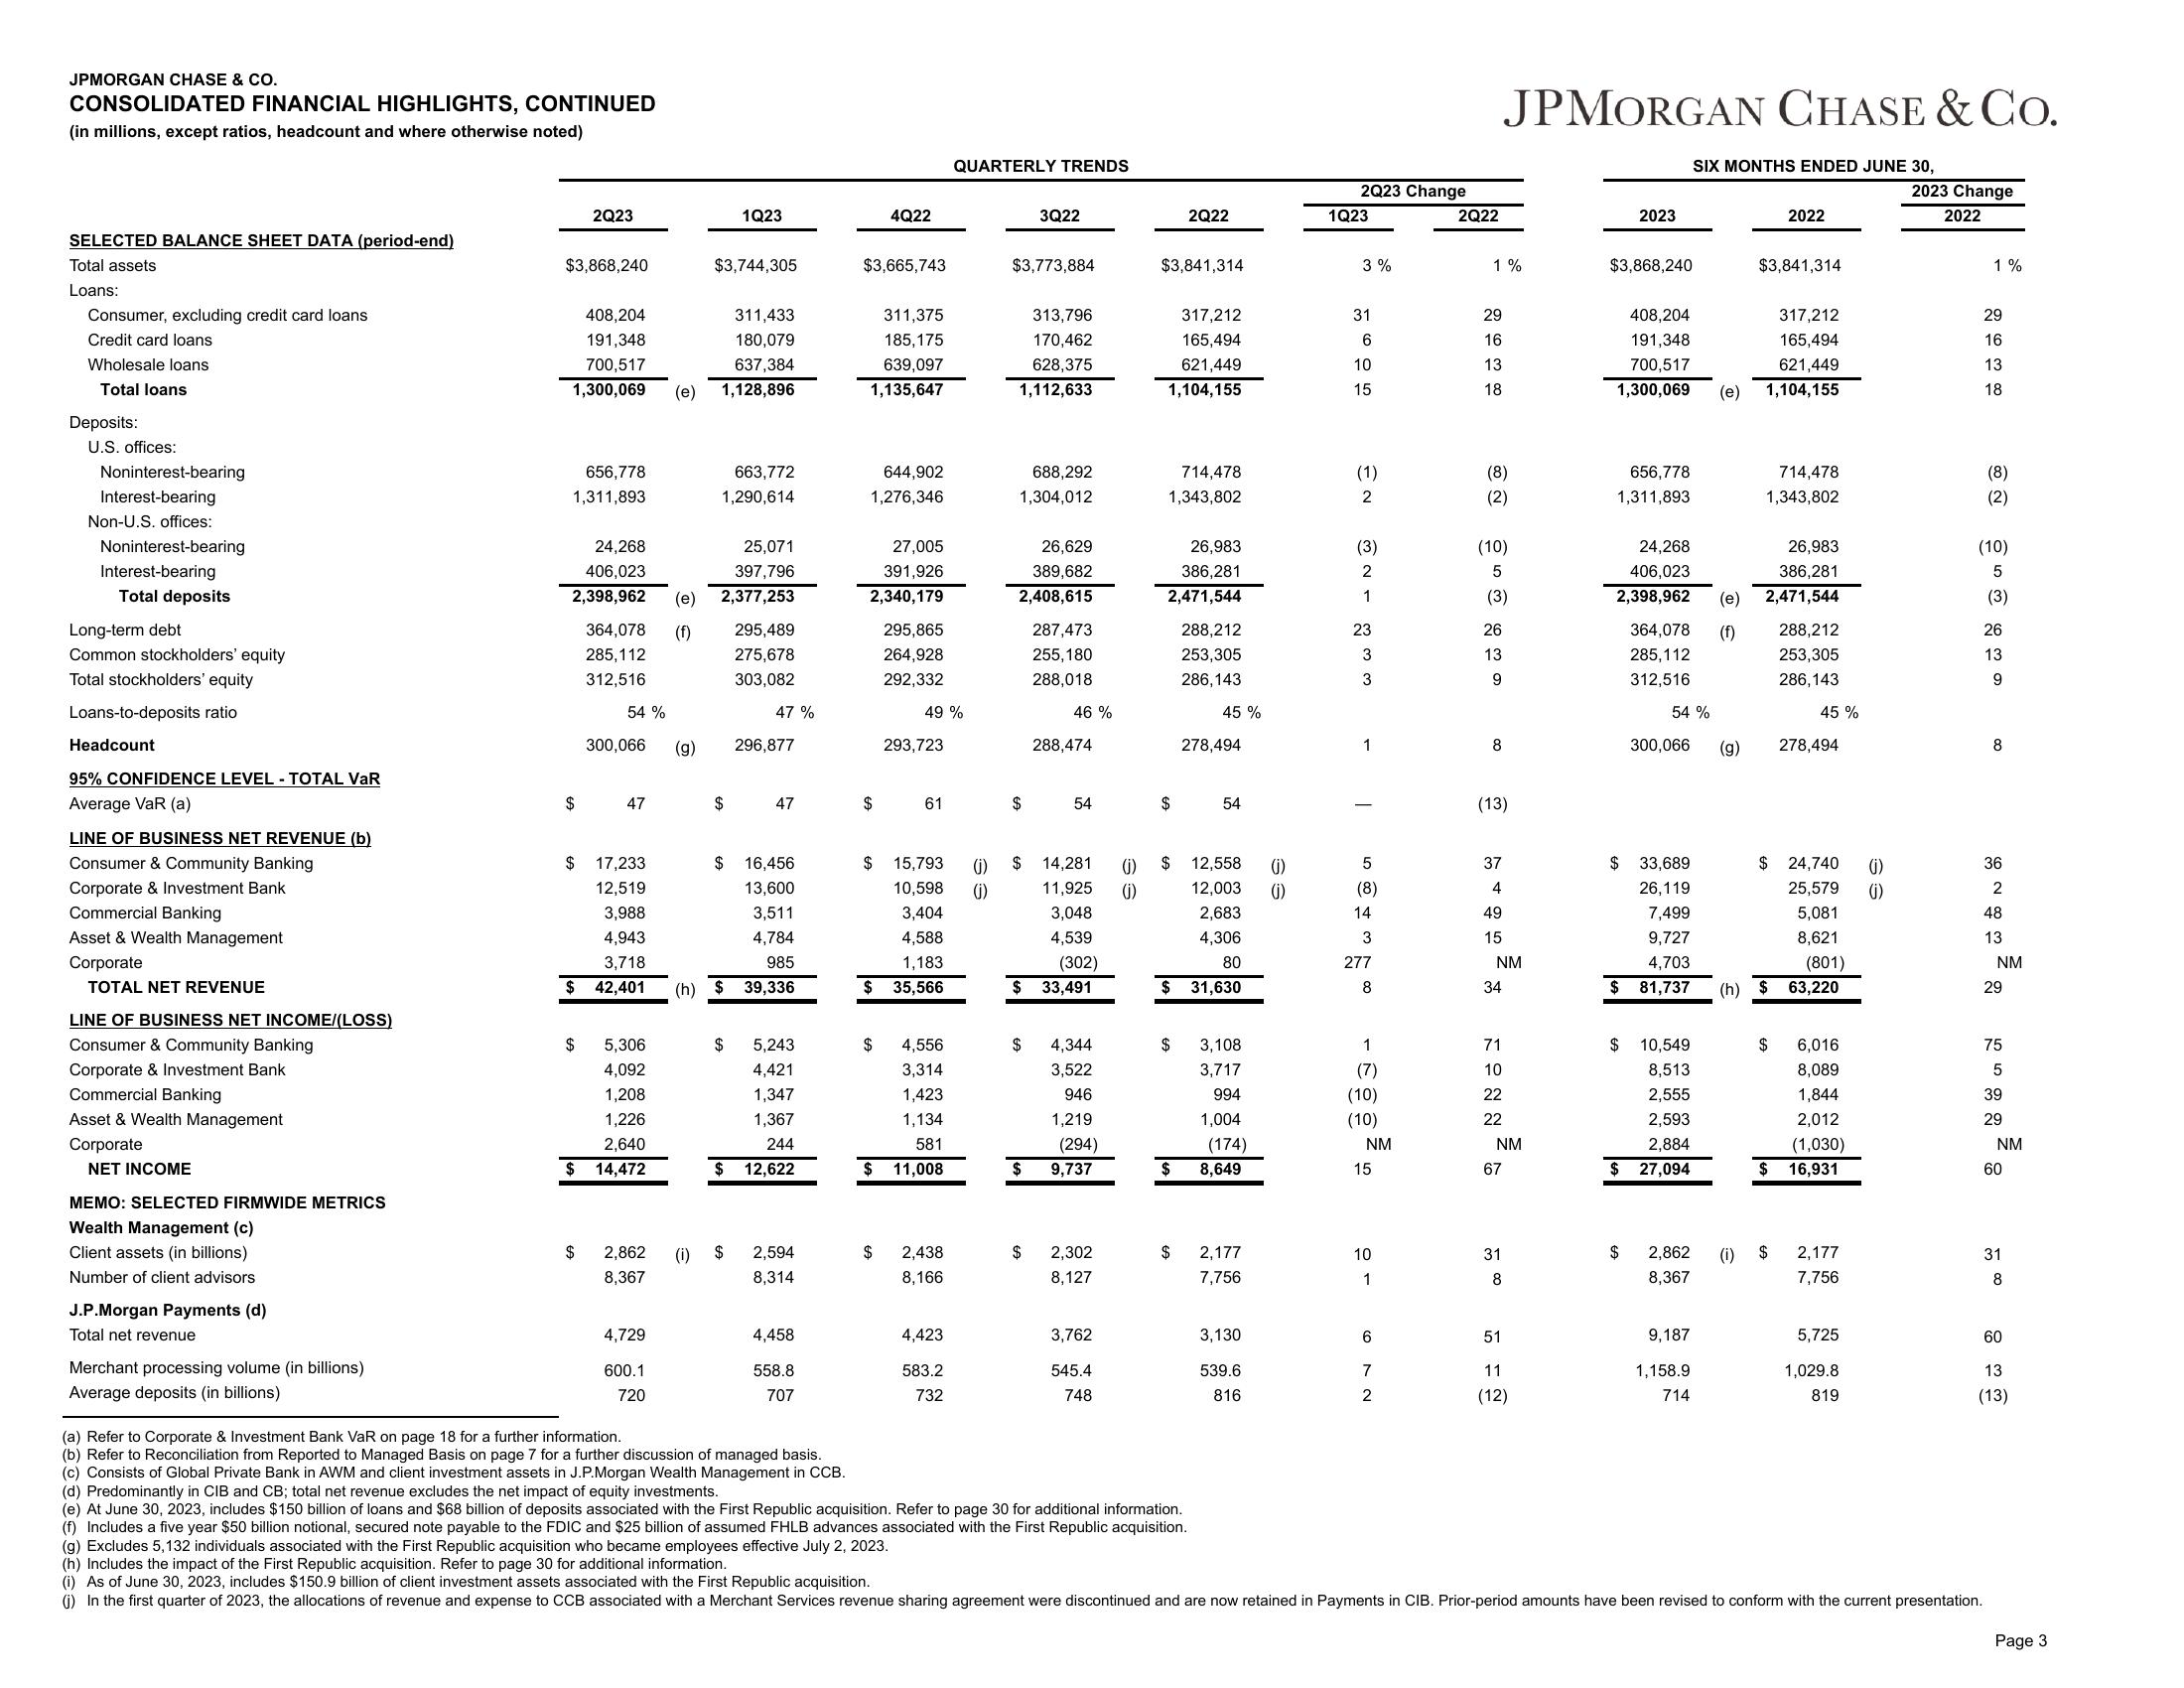
CONSOLIDATED FINANCIAL HIGHLIGHTS, CONTINUED
(in millions, except ratios, headcount and where otherwise noted)
SELECTED BALANCE SHEET DATA (period-end)
Total assets
Loans:
Consumer, excluding credit card loans
Credit card loans
Wholesale loans
Total loans
Deposits:
U.S. offices:
Noninterest-bearing
Interest-bearing
Non-U.S. offices:
Noninterest-bearing
Interest-bearing
Total deposits
Long-term debt
Common stockholders' equity
Total stockholders' equity
Loans-to-deposits ratio
Headcount
95% CONFIDENCE LEVEL - TOTAL VAR
Average VaR (a)
LINE OF BUSINESS NET REVENUE (b)
Consumer & Community Banking
Corporate & Investment Bank
Commercial Banking
Asset & Wealth Management
Corporate
TOTAL NET REVENUE
LINE OF BUSINESS NET INCOME/(LOSS)
Consumer & Community Banking
Corporate & Investment Bank
Commercial Banking
Asset & Wealth Management
Corporate
NET INCOME
MEMO: SELECTED FIRMWIDE METRICS
Wealth Management (c)
Client assets (in billions)
Numbe
J.P.Morgan Payments (d)
Total net revenue
Merchant processing volume (in billions)
Average deposits (in billions)
$3,868,240
2Q23
656,778
1,311,893
408,204
311,433
180,079
191,348
700,517
637,384
1,300,069 (e) 1,128,896
$
$
24,268
25,071
406,023
397,796
2,398,962 (e) 2,377,253
364,078 (f)
285,112
312,516
54%
300,066 (g)
47
17,233
12,519
3,988
4,943
3,718
$ 42,401 (h)
$ 5,306
4,092
1,208
1,226
2,640
14,472
$ 2,862 (1)
8,367
$3,744,305
4,729
600.1
720
1Q23
663,772
1,290,614
$
$
295,489
275,678
303,082
47 %
296,877
47
$ 16,456
13,600
3,511
4,784
985
39,336
5,243
4,421
1,347
1,367
244
$ 12,622
$ 2,594
4,458
558.8
707
(a) Refer to Corporate & Investment Bank VaR on page 18 for a further information.
(b) Refer to Reconciliation from Reported to Managed Basis on page 7 for a further discussion of managed basis.
(c) Consists of Global Private Bank in AWM and client investment assets in J.P.Morgan Wealth Management in CCB.
$3,665,743
4Q22
311,375
185,175
639,097
1,135,647
644,902
1,276,346
27,005
391,926
2,340,179
$
$
295,865
264,928
292,332
49 %
293,723
61
15,793
10,598 (j)
3,404
4,588
1,183
$ 35,566
4,556
3,314
1,423
1,134
581
$ 11,008
QUARTERLY TRENDS
$ 2,438
8,166
4,423
583.2
732
$3,773,884
313,796
170,462
628,375
1,112,633
3Q22
688,292
1,304,012
26,629
389,682
2,408,615
$
$
287,473
255,180
288,018
$
46 %
(j) $ 14,281
(j)
11,925 (j)
3,048
4,539
288,474
54
(302)
$ 33,491
4,344
3,522
946
1,219
(294)
9,737
2,302
8,127
3,762
545.4
748
$3,841,314
317,212
165,494
621,449
1,104,155
714,478
1,343,802
26,983
386,281
2,471,544
$
$
2Q22
$
$
$
$
288,212
253,305
286,143
45%
278,494
54
12,558
12,003
2,683
4,306
80
31,630
3,108
3,717
994
1,004
(174)
8,649
2,177
7,75
3,130
539.6
816
(j)
(j)
2Q23 Change
1Q23
3%
31
6
10
15
(1)
2
(3)
2
1
23
3
3
1
I
o + ෆ
5
(8)
277
8
1
(7)
(10)
(10)
NM
15
10
1
6
7
2
2Q22
1%
29
16
13
18
(8)
(2)
(10)
5
(3)
26
13
9
JPMORGAN CHASE & Co.
8
(13)
37
4
49
15
NM
34
71
10
22
22
NM
67
31
8
51
11
(12)
2023
$3,868,240
408,204
191,348
700,517
1,300,069
656,778
1,311,893
$
364,078 (f)
285,112
312,516
54%
300,066
SIX MONTHS ENDED JUNE 30,
$ 10,549
8,513
2,555
2,593
2,884
27,094
26,983
386,281
2,398,962 (e) 2,471,544
24,268
406,023
(e)
$ 33,689
26,119
7,499
9,727
4,703
$ 81,737 (h)
2,862
8,367
9,187
1,158.9
714
(g)
$3,841,314
2022
317,212
165,494
621,449
1,104,155
714,478
1,343,802
$
288,212
253,305
286,143
(i) $
45%
$ 24,740
25,579
5,081
8,621
(801)
63,220
278,494
6,016
8,089
1,844
2,012
(1,030)
$ 16,931
2,177
7,756
5,725
1,029.8
819
(j)
(j)
2023 Change
2022
1%
29
16
13
18
(d) Predominantly in CIB and CB; total net revenue excludes the net impact of equity investments.
(e) At June 30, 2023, includes $150 billion of loans and $68 billion of deposits associated with the First Republic acquisition. Refer to page 30 for additional information.
(f) Includes a five year $50 billion notional, secured note payable to the FDIC and $25 billion of assumed FHLB advances associated with the First Republic acquisition.
(g) Excludes 5,132 individuals associated with the First Republic acquisition who became employees effective July 2, 2023.
(h) Includes the impact of the First Republic acquisition. Refer to page 30 for additional information.
(i) As of June 30, 2023, includes $150.9 billion of client investment assets associated with the First Republic acquisition.
(j) In the first quarter of 2023, the allocations of revenue and expense to CCB associated with a Merchant Services revenue sharing agreement were discontinued and are now retained in Payments in CIB. Prior-period amounts have been revised to conform with the current presentation.
(8)
(2)
(10)
5
(3)
26
13
9
8
36
2
48
13
NM
60
29
75
5
39
29
NM
60
31
8
60
13
(13)
Page 3View entire presentation