Roblox Results Presentation Deck
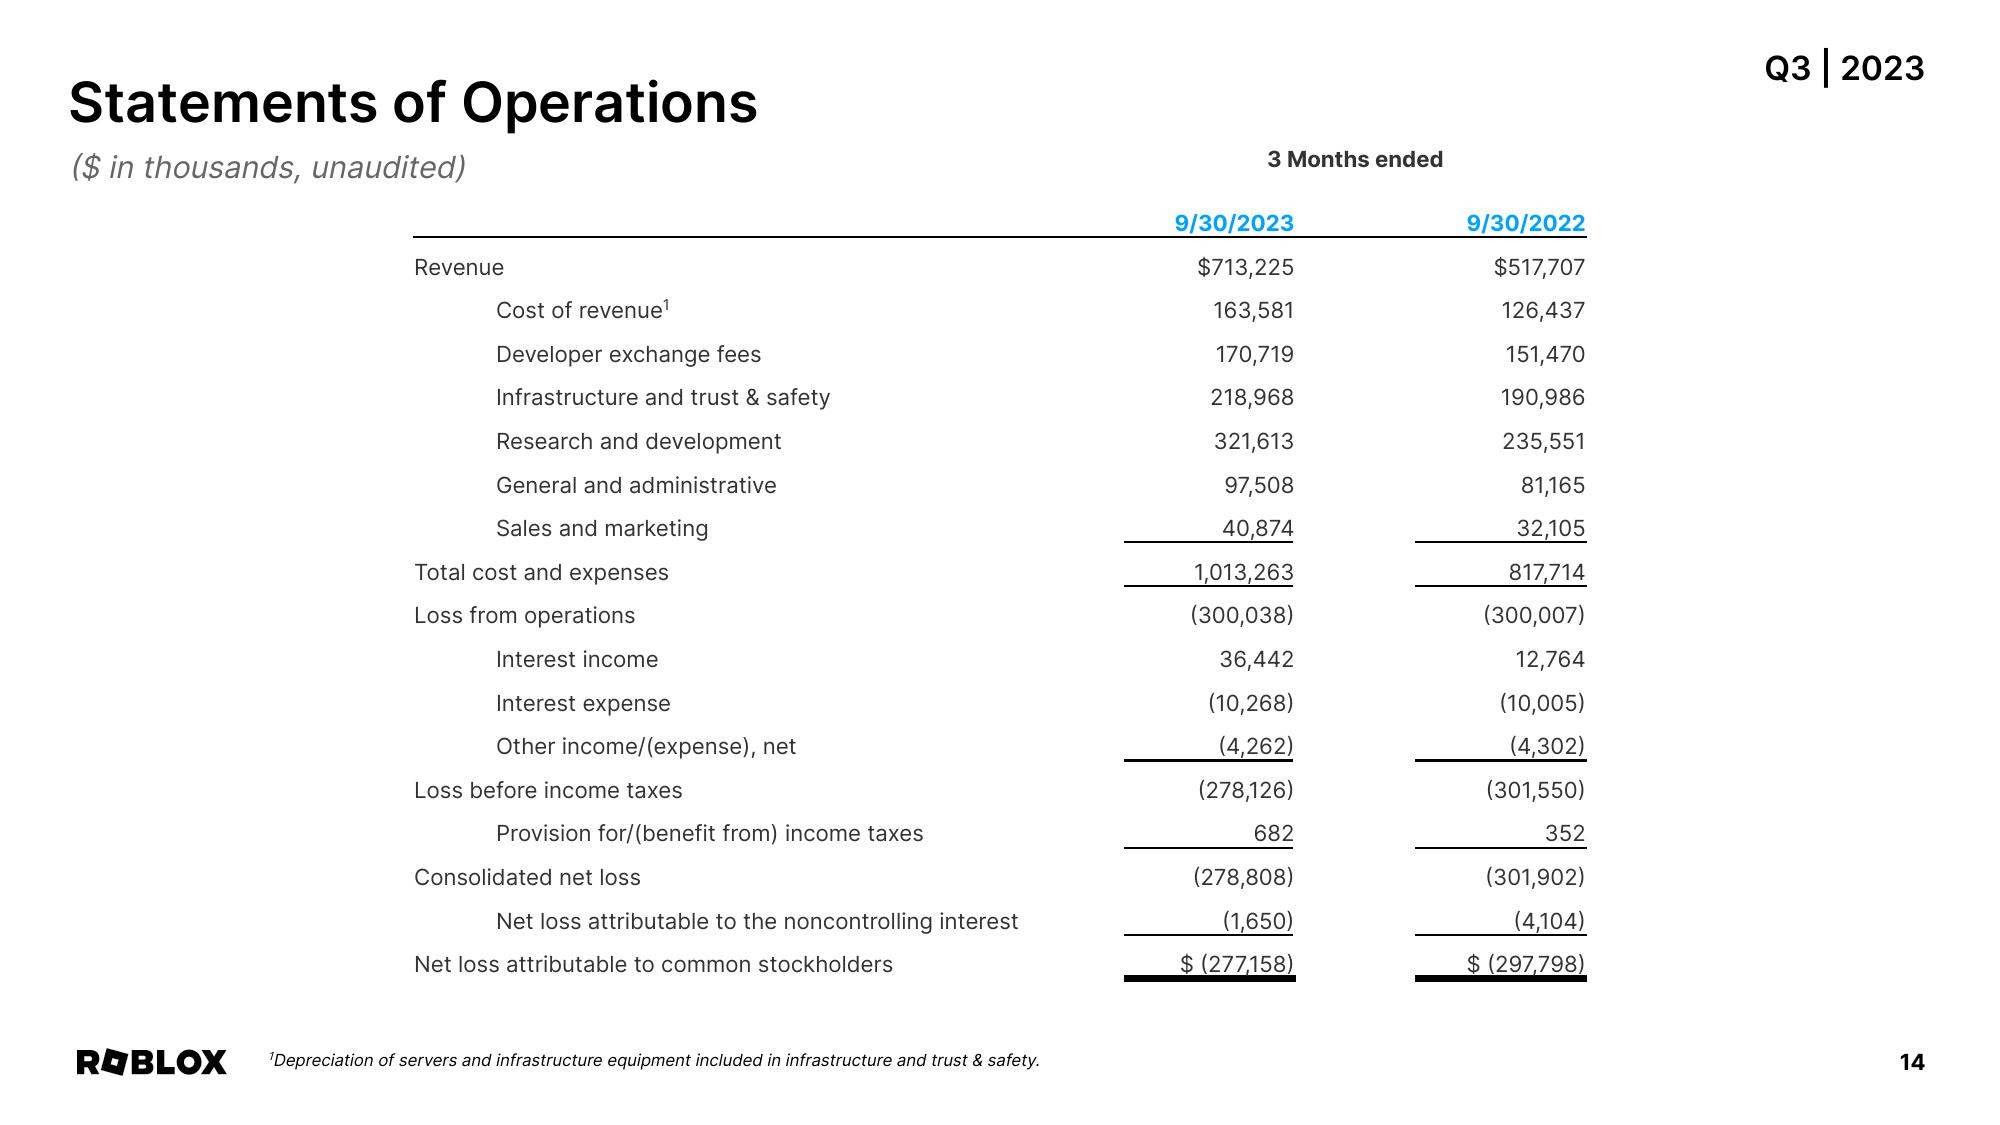
Statements of Operations
($ in thousands, unaudited)
ROBLOX
Revenue
Cost of revenue¹
Developer exchange fees
Infrastructure and trust & safety
Research and development
General and administrative
Sales and marketing
Total cost and expenses
Loss from operations
Interest income
Interest expense
Other income/(expense), net
Loss before income taxes
Provision for/(benefit from) income taxes
Consolidated net loss
Net loss attributable to the noncontrolling interest
Net loss attributable to common stockholders
¹Depreciation of servers and infrastructure equipment included in infrastructure and trust & safety.
3 Months ended
9/30/2023
$713,225
163,581
170,719
218,968
321,613
97,508
40,874
1,013,263
(300,038)
36,442
(10,268)
(4,262)
(278,126)
682
(278,808)
(1,650)
$ (277,158)
9/30/2022
$517,707
126,437
151,470
190,986
235,551
81,165
32,105
817,714
(300,007)
12,764
(10,005)
(4,302)
(301,550)
352
(301,902)
(4,104)
$ (297,798)
Q3 | 2023
14View entire presentation