Vivid Seats Results Presentation Deck
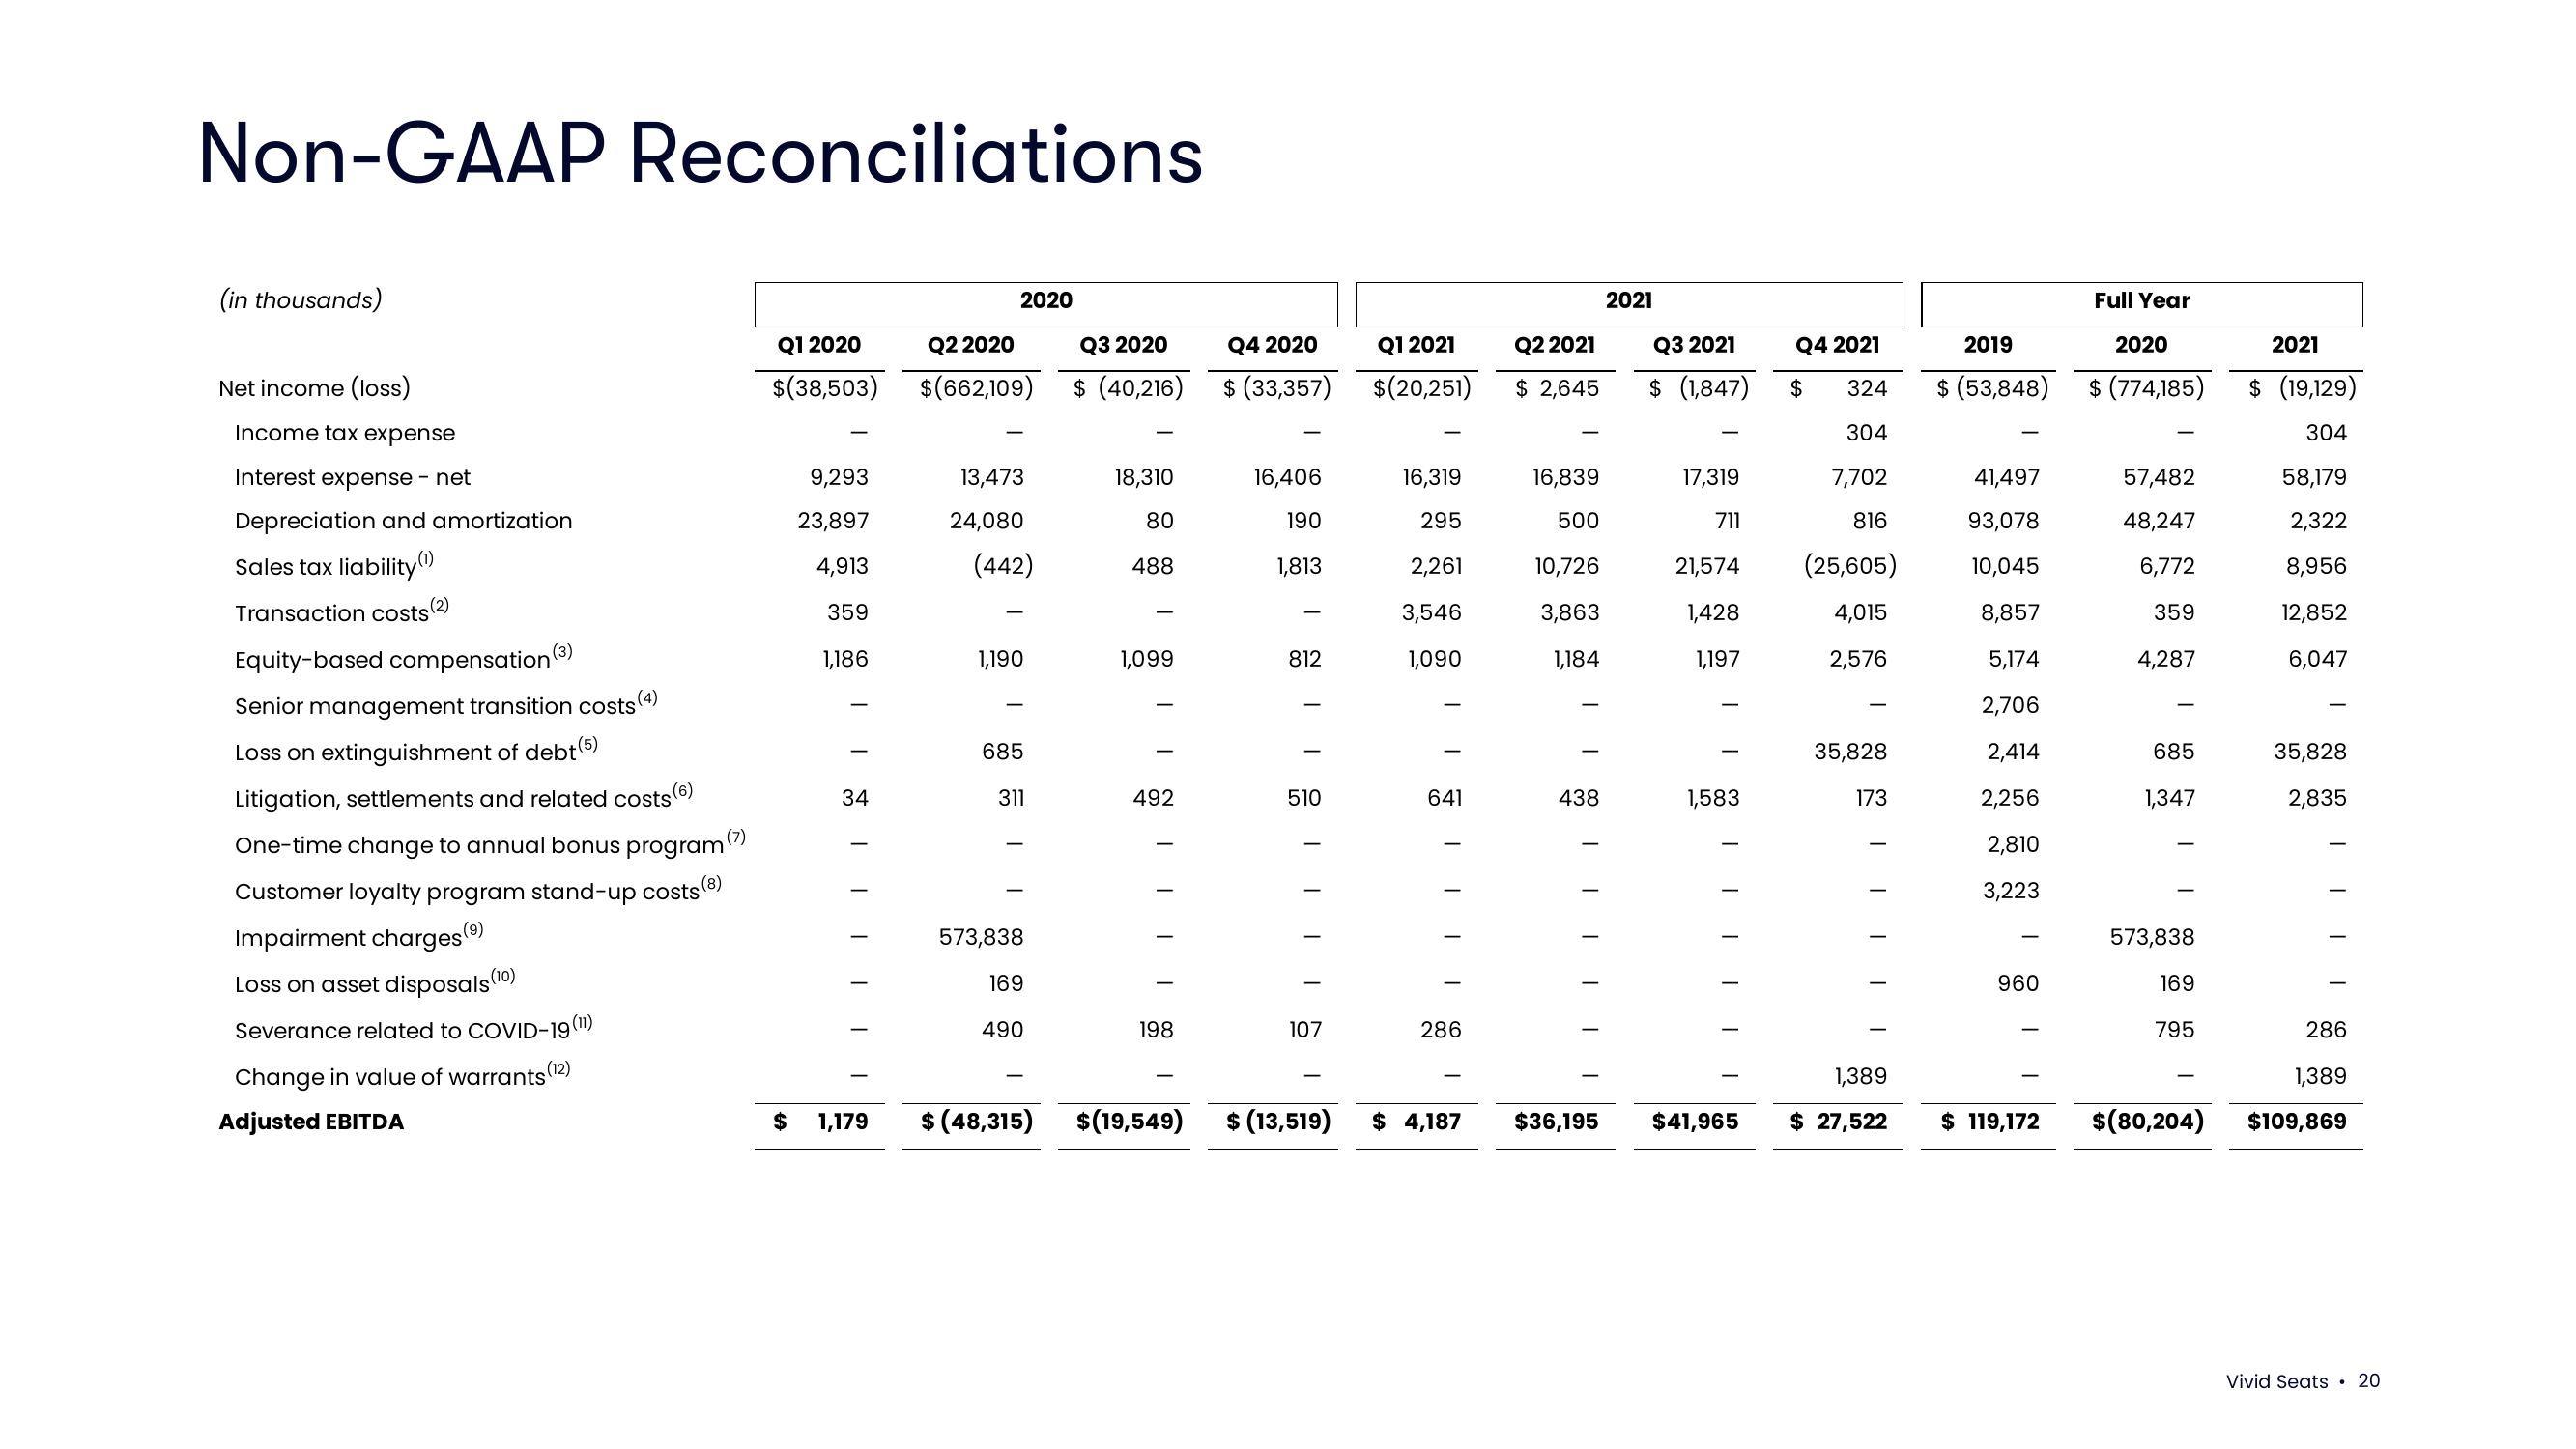
Non-GAAP Reconciliations
(in thousands)
Net income (loss)
Income tax expense
Interest expense - net
Depreciation and amortization
Sales tax liability (1)
Transaction costs (2)
Equity-based compensation (3)
Senior management transition costs (4)
Loss on extinguishment of debt (5)
Litigation, settlements and related costs (6)
One-time change to annual bonus program (7)
Customer loyalty program stand-up costs (8)
Impairment charges (⁹)
Loss on asset disposals (10)
Severance related to COVID-19 (11)
Change in value of warrants (¹2)
Adjusted EBITDA
Q1 2020
$(38,503)
$
9,293
23,897
4,913
359
1,186
34
III
1,179
2020
Q2 2020
$(662,109)
13,473
24,080
(442)
1,190
685
311
573,838
169
490
$ (48,315)
Q3 2020
Q4 2020
$ (40,216) $ (33,357)
18,310
80
488
1,099
I
T
492
T
198
16,406
190
1,813
812
T
I
510
T
107
Q1 2021
$(20,251)
16,319
295
2,261
3,546
1,090
641
| | |
I
286
$(19,549) $ (13,519) $ 4,187
Q2 2021
$ 2,645
16,839
500
10,726
3,863
1,184
438
I
I
$36,195
2021
Q3 2021
$ (1,847)
Q4 2021
$
324
304
7,702
816
21,574 (25,605)
1,428
4,015
1,197
2,576
17,319
711
1,583
T
$41,965
35,828
173
II
1,389
$ 27,522
2019
$ (53,848)
41,497
93,078
10,045
8,857
5,174
2,706
2,414
2,256
2,810
3,223
960
$ 119,172
Full Year
2020
$ (774,185)
57,482
48,247
6,772
359
4,287
685
1,347
573,838
169
795
$(80,204)
2021
$ (19,129)
304
58,179
2,322
8,956
12,852
6,047
35,828
2,835
T
286
1,389
$109,869
Vivid Seats 20View entire presentation