Quanergy SPAC Presentation Deck
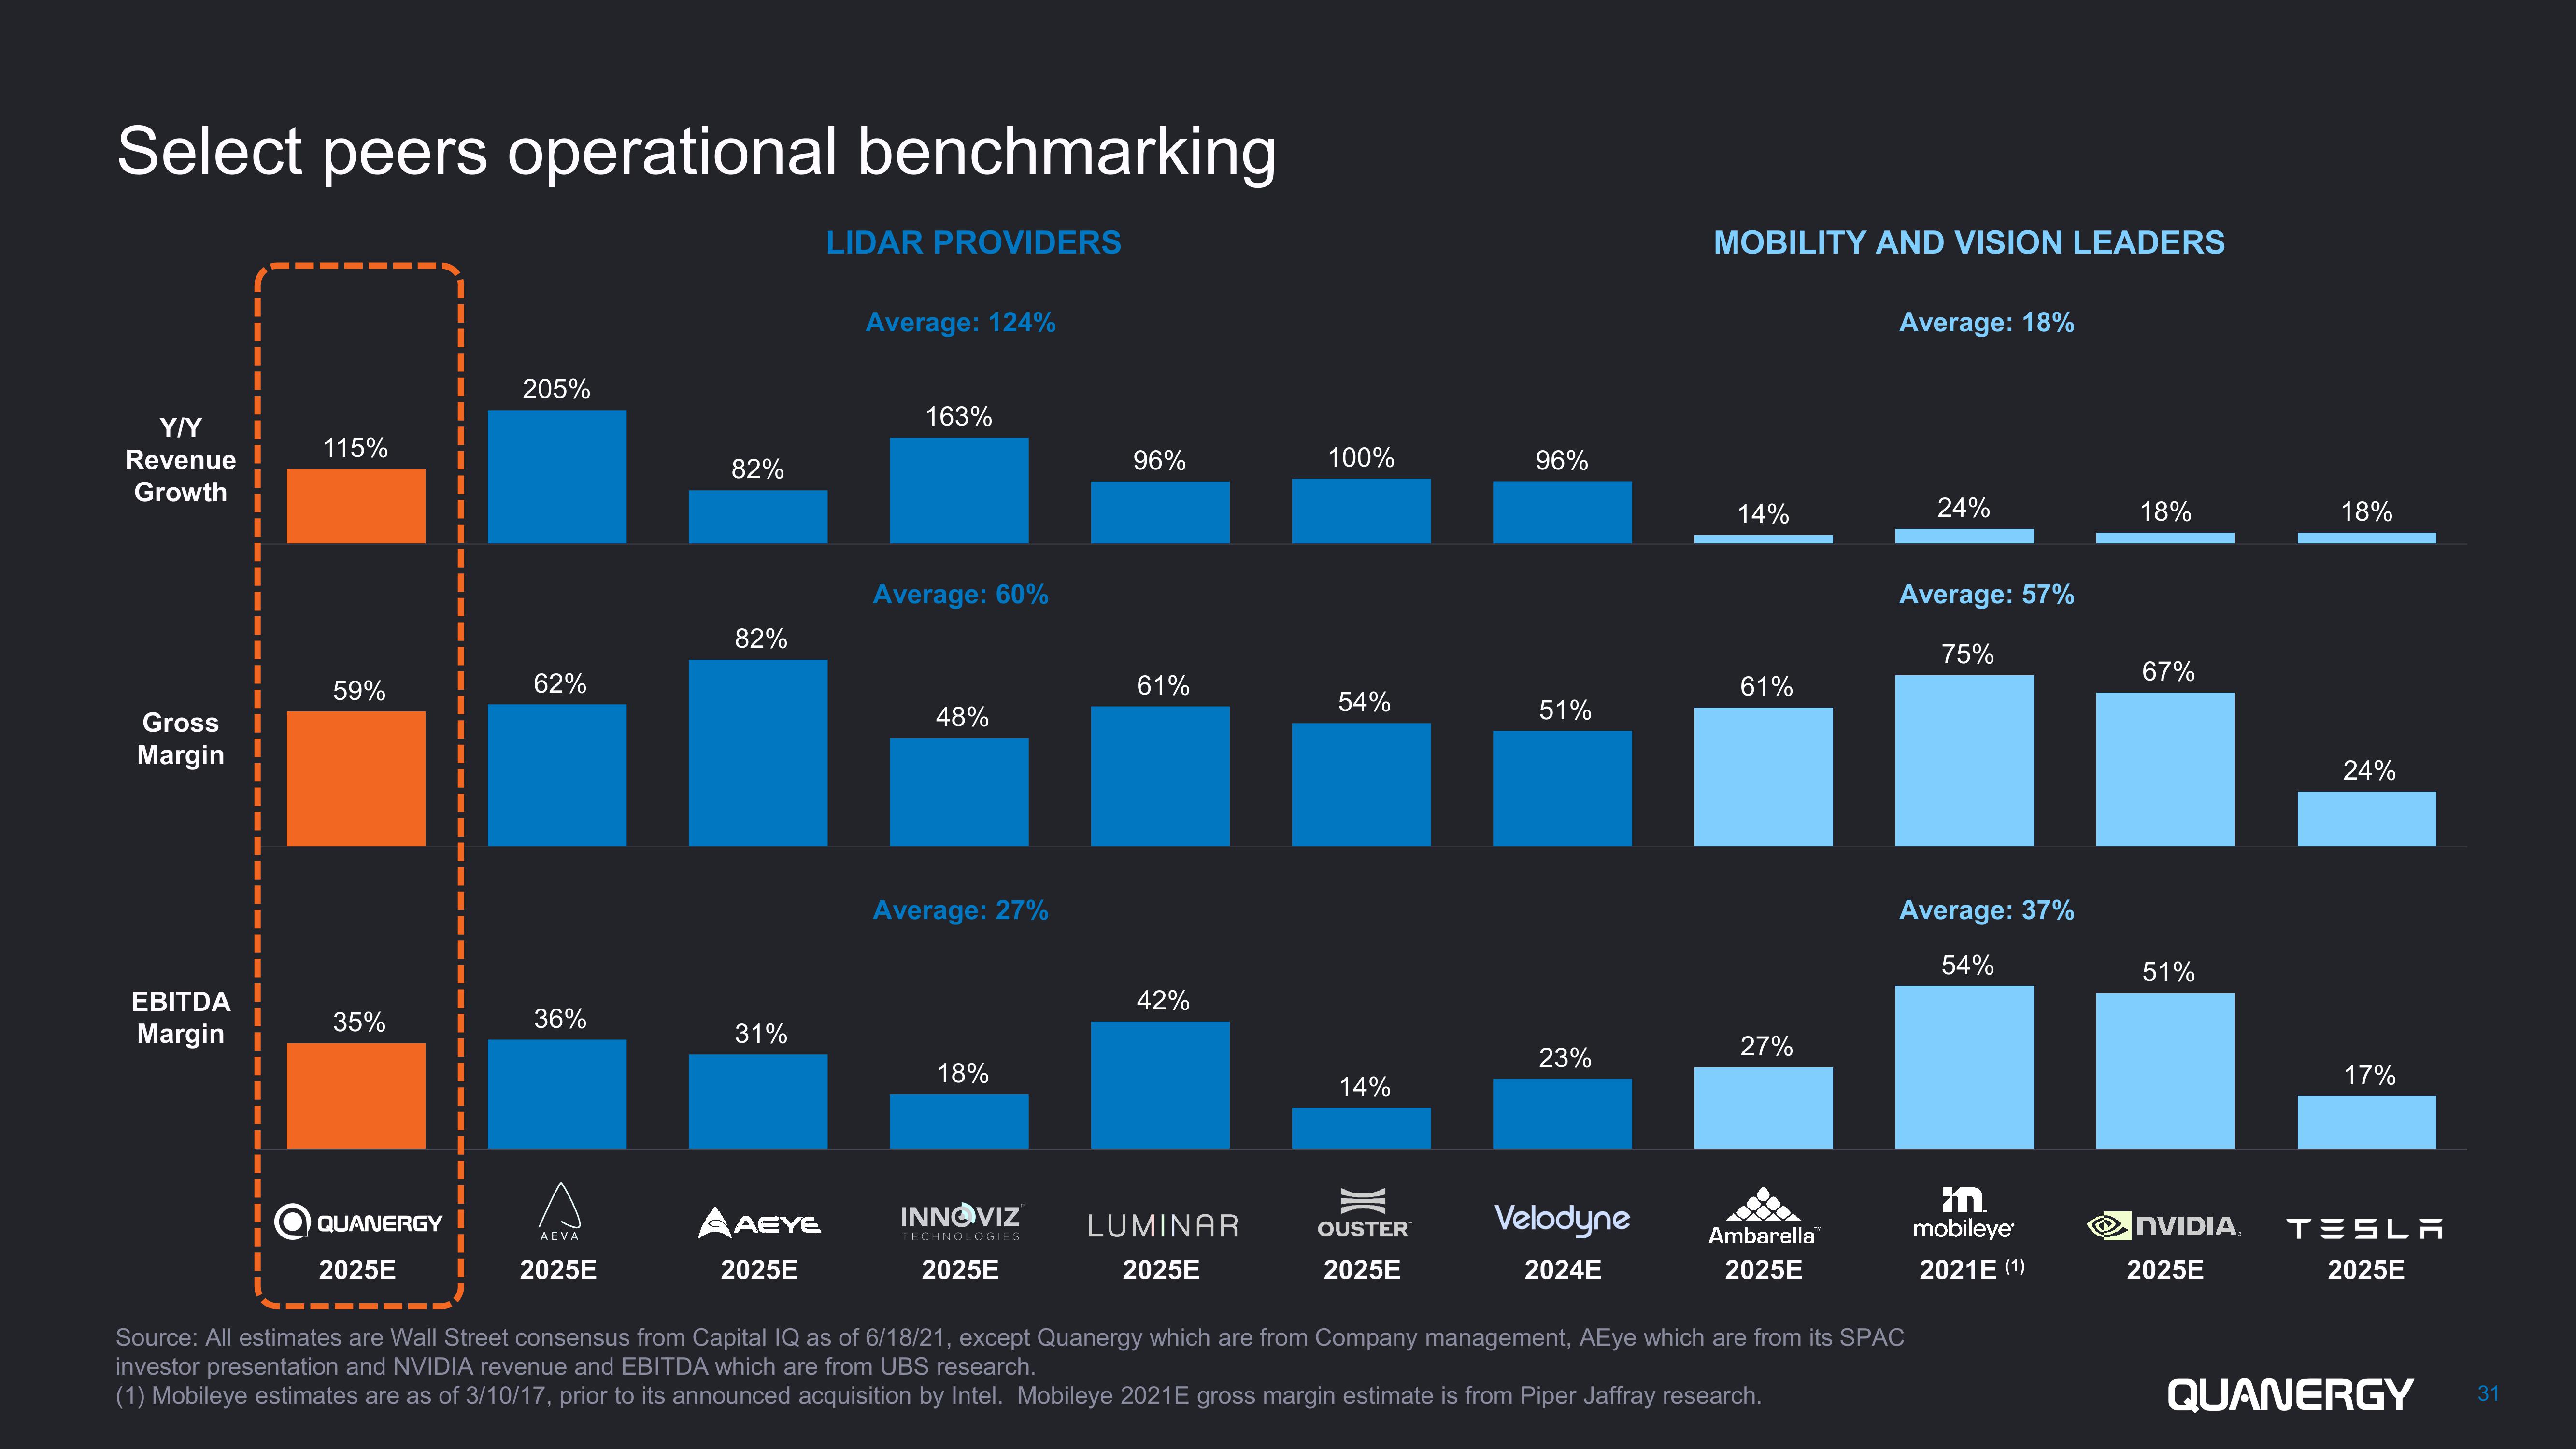
Select peers operational benchmarking
Y/Y
Revenue
Growth
Gross
Margin
EBITDA
Margin
115%
59%
35%
QUANERGY
2025E
205%
62%
36%
AEVA
2025E
82%
82%
31%
AAEYE
2025E
LIDAR PROVIDERS
Average: 124%
163%
Average: 60%
48%
Average: 27%
18%
INNOVIZ
TECHNOLOGIES
2025E
96%
61%
42%
LUMINAR
2025E
100%
54%
14%
OUSTER
2025E
96%
51%
23%
Velodyne
2024E
MOBILITY AND VISION LEADERS
14%
61%
27%
Ambarella
2025E
Average: 18%
24%
Average: 57%
75%
Average: 37%
54%
Source: All estimates are Wall Street consensus from Capital IQ as of 6/18/21, except Quanergy which are from Company management, AEye which are from its SPAC
investor presentation and NVIDIA revenue and EBITDA which are from UBS research.
(1) Mobileye estimates are as of 3/10/17, prior to its announced acquisition by Intel. Mobileye 2021E gross margin estimate is from Piper Jaffray research.
m
mobileye
2021E (1)
18%
67%
51%
NVIDIA
2025E
18%
24%
17%
TESLA
2025E
QUANERGY
31View entire presentation