LegalZoom.com Investor Presentation Deck
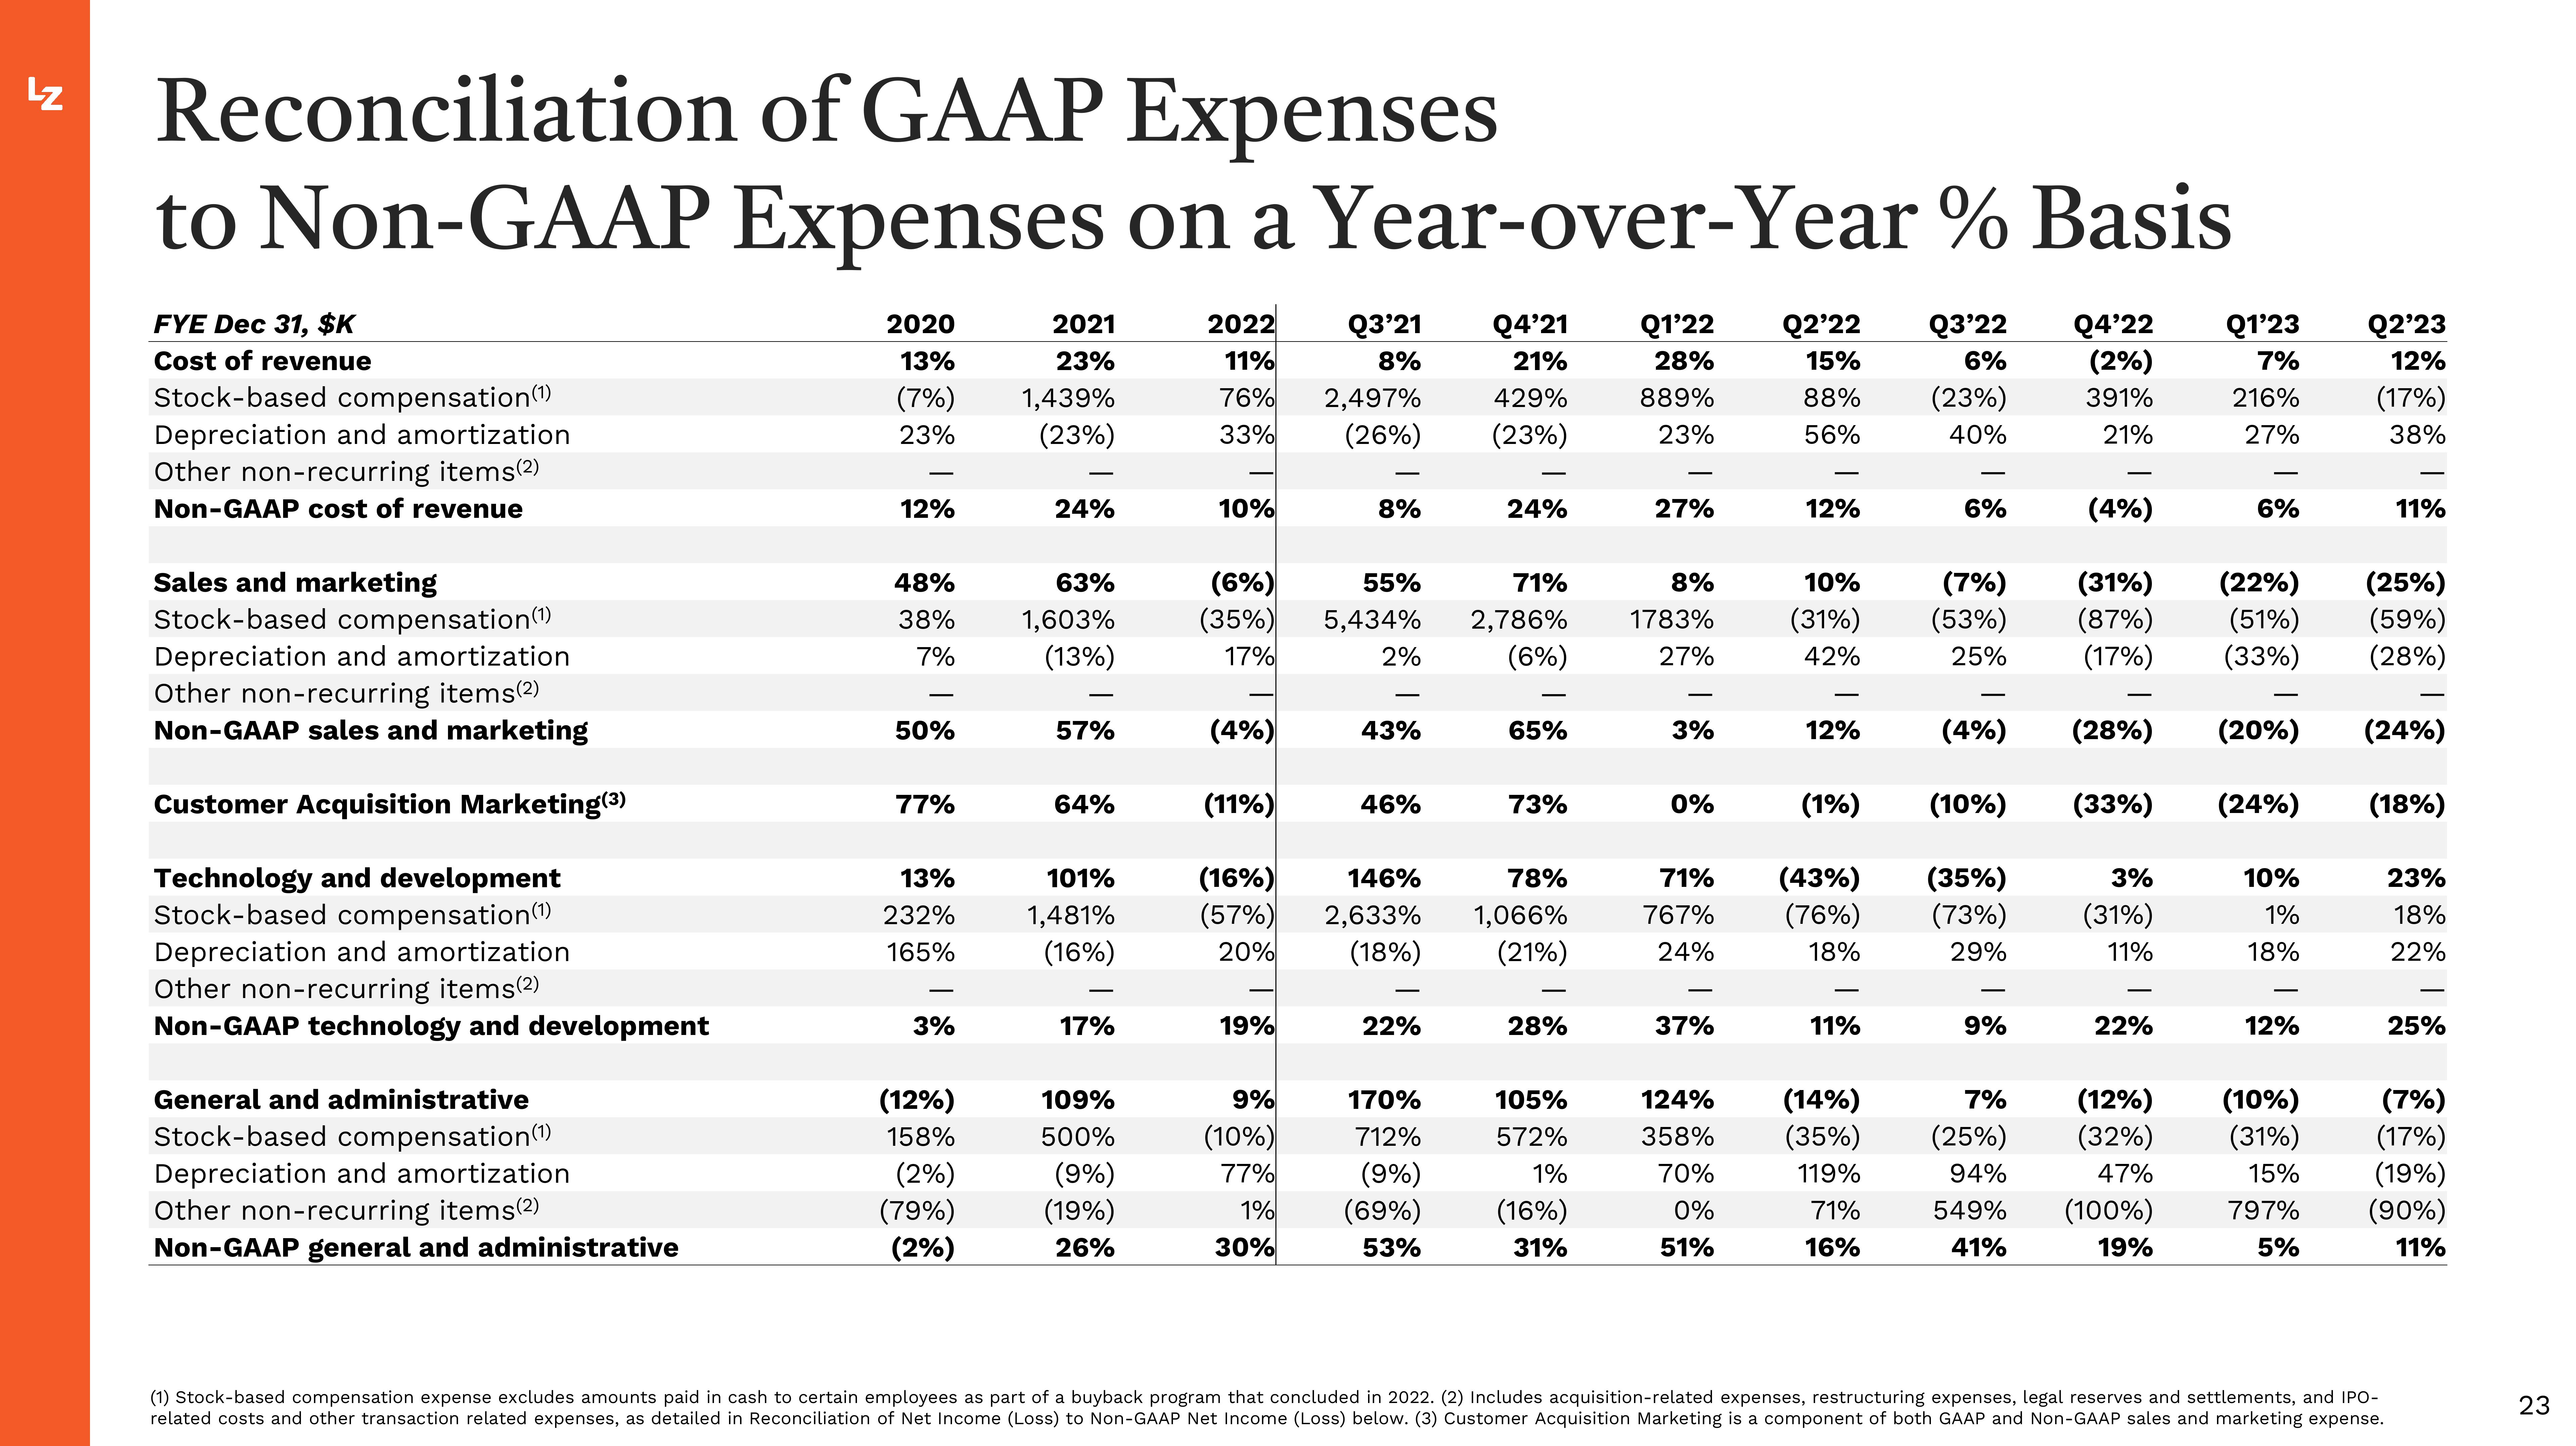
Lz Reconciliation of GAAP Expenses
to Non-GAAP Expenses on a Year-over-Year % Basis
FYE Dec 31, $K
Cost of revenue
2020
13%
(7%)
Q3'22 Q4'22 Q1'23
6% (2%)
7%
(23%) 391%
216%
40%
21%
27%
23%
Stock-based compensation (¹)
Depreciation and amortization
Other non-recurring items (2)
Non-GAAP cost of revenue
Sales and marketing
Stock-based compensation (¹)
Depreciation and amortization
Other non-recurring items(2)
Non-GAAP sales and marketing
Customer Acquisition Marketing (3)
Technology and development
Stock-based compensation(¹)
Depreciation and amortization
Other non-recurring items (2)
Non-GAAP technology and development
General and administrative
Stock-based compensation (¹)
Depreciation and amortization
Other non-recurring items(2)
Non-GAAP general and administrative
12%
48%
38%
7%
50%
77%
13%
232%
165%
3%
(12%)
158%
(2%)
(79%)
(2%)
2021
23%
1,439%
(23%)
24%
63%
1,603%
(13%)
57%
64%
101%
1,481%
(16%)
17%
109%
500%
(9%)
(19%)
26%
2022 Q3'21 Q4'21
11%
8%
21%
76% 2,497% 429%
33% (26%) (23%)
10%
(6%)
(35%)
17%
(4%)
(11%)
19%
8%
9%
(10%)
77%
1%
30%
55%
5,434%
2%
43%
(16%)
146%
(57%) 2,633%
20%
(18%)
46%
22%
170%
712%
(9%)
(69%)
53%
24%
71%
2,786%
(6%)
65%
73%
78%
1,066%
(21%)
28%
105%
572%
1%
(16%)
31%
Q1'22 Q2'22
28%
889%
23%
15%
88%
56%
27%
8%
1783%
27%
3%
0%
71%
767%
24%
37%
124%
358%
70%
0%
51%
12%
10%
(31%)
42%
12%
(1%)
6%
11%
(7%)
(53%)
25%
(4%)
(43%) (35%)
(76%) (73%)
18%
29%
(4%)
9%
(10%) (33%)
2
(22%) (25%)
(31%)
(87%)
(17%)
(59%)
(51%)
(33%)
(28%)
(28%) (20%)
3%
(31%)
11%
22%
6%
(14%)
7%
(35%) (25%) (32%)
119%
94%
47%
71% 549% (100%)
41%
19%
16%
(24%)
10%
1%
18%
12%
Q2'23
12%
(17%)
38%
(12%) (10%)
(31%)
15%
797%
5%
11%
(24%)
(18%)
(1) Stock-based compensation expense excludes amounts paid in cash to certain employees as part of a buyback program that concluded in 2022. (2) Includes acquisition-related expenses, restructuring expenses, legal reserves and settlements, and IPO-
related costs and other transaction related expenses, as detailed in Reconciliation of Net Income (Loss) to Non-GAAP Net Income (Loss) below. (3) Customer Acquisition Marketing is a component of both GAAP and Non-GAAP sales and marketing expense.
23%
18%
22%
25%
(7%)
(17%)
(19%)
(90%)
11%
23View entire presentation