Innovid Investor Day Presentation Deck
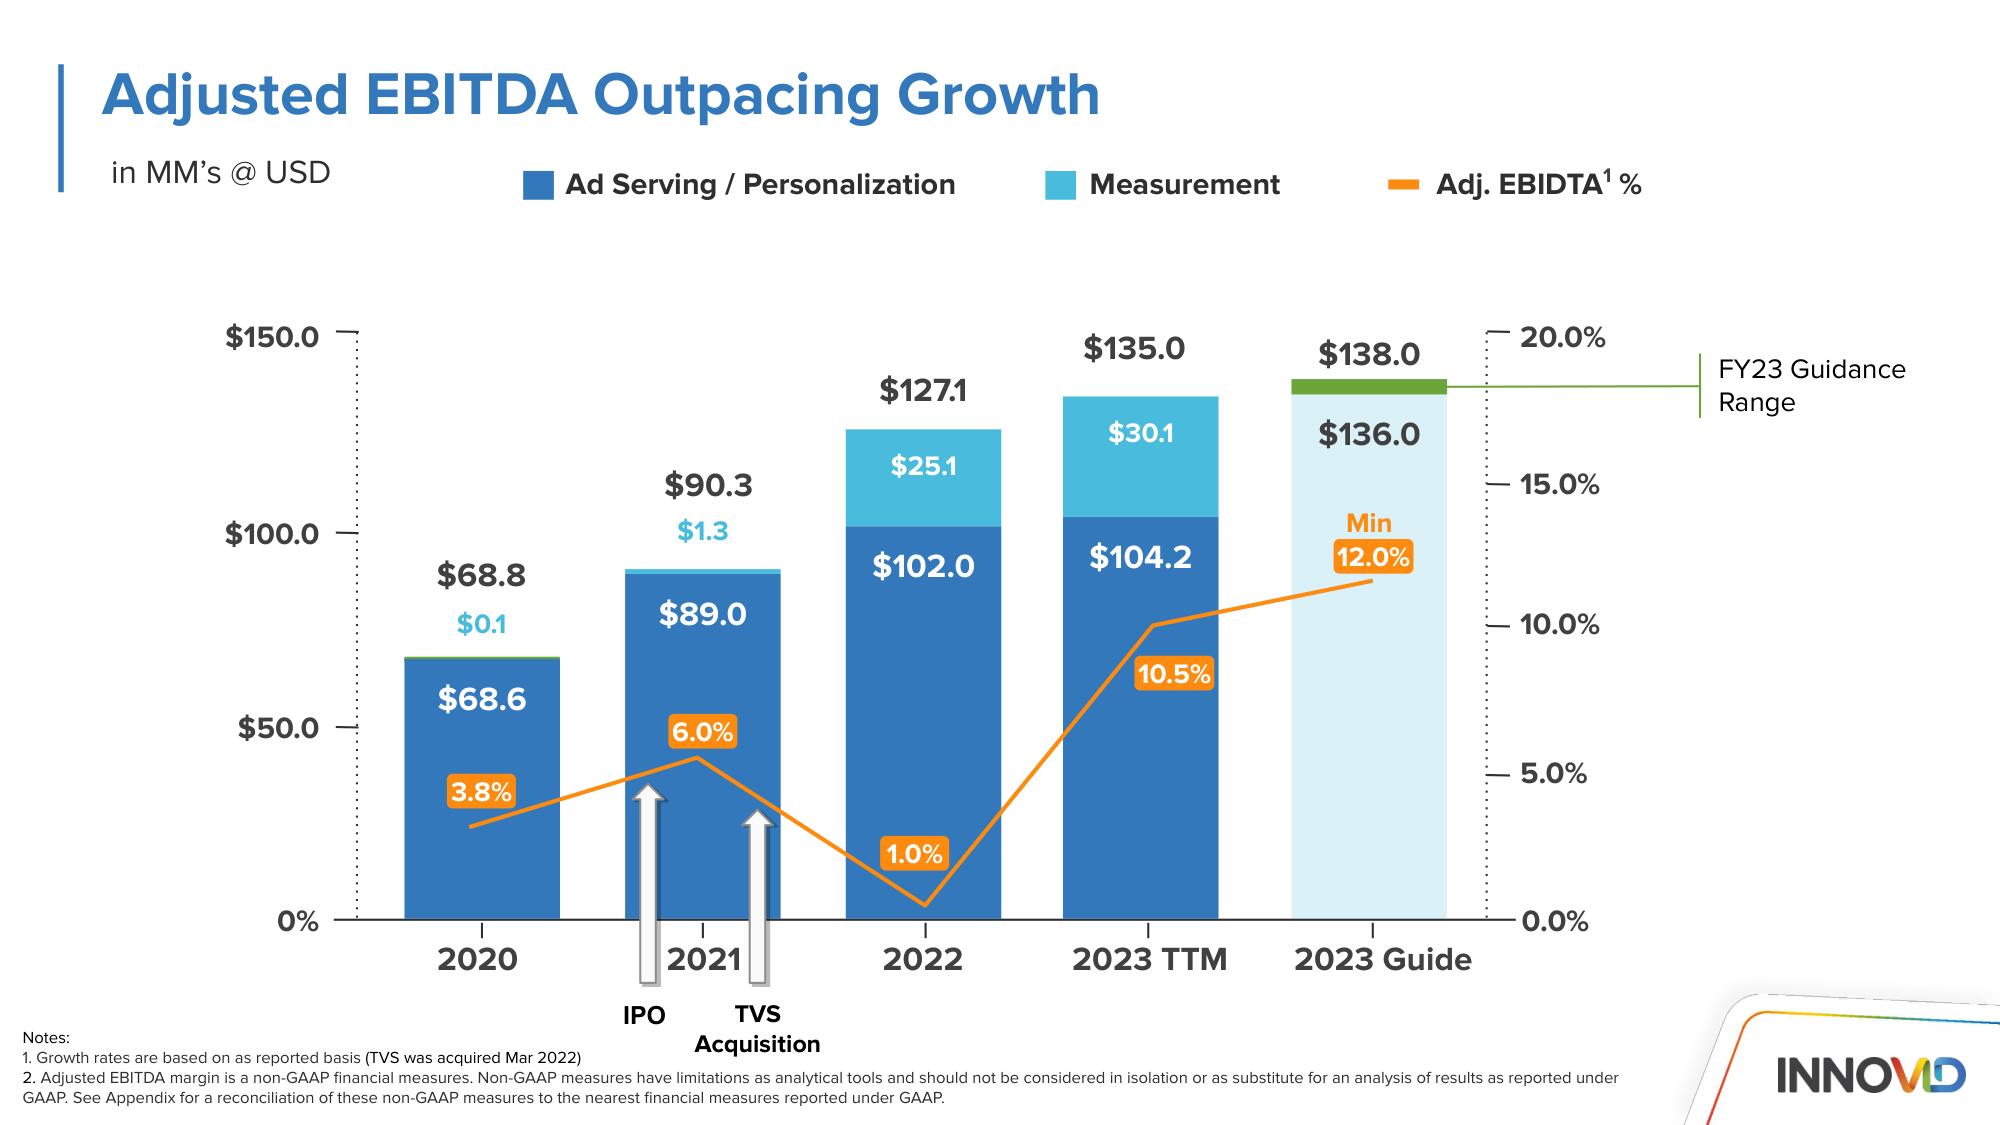
Adjusted EBITDA Outpacing Growth
in MM's @ USD
Ad Serving / Personalization
$150.0
$100.0
$50.0
0%
$68.8
$0.1
$68.6
3.8%
I
2020
$90.3
$1.3
$89.0
6.0%
2021
IPO
TVS
Acquisition
$127.1
$25.1
$102.0
1.0%
2022
Measurement
$135.0
$30.1
$104.2
10.5%
2023 TTM
$138.0
$136.0
Min
12.0%
Adj. EBIDTA¹%
2023 Guide
20.0%
15.0%
10.0%
5.0%
0.0%
Notes:
1. Growth rates are based on as reported basis (TVS was acquired Mar 2022)
2. Adjusted EBITDA margin is a non-GAAP financial measures. Non-GAAP measures have limitations as analytical tools and should not be considered in isolation or as substitute for an analysis of results as reported under
GAAP. See Appendix for a reconciliation of these non-GAAP measures to the nearest financial measures reported under GAAP.
FY23 Guidance
Range
INNOVDView entire presentation