Evercore Investment Banking Pitch Book
Situation Analysis
Overview
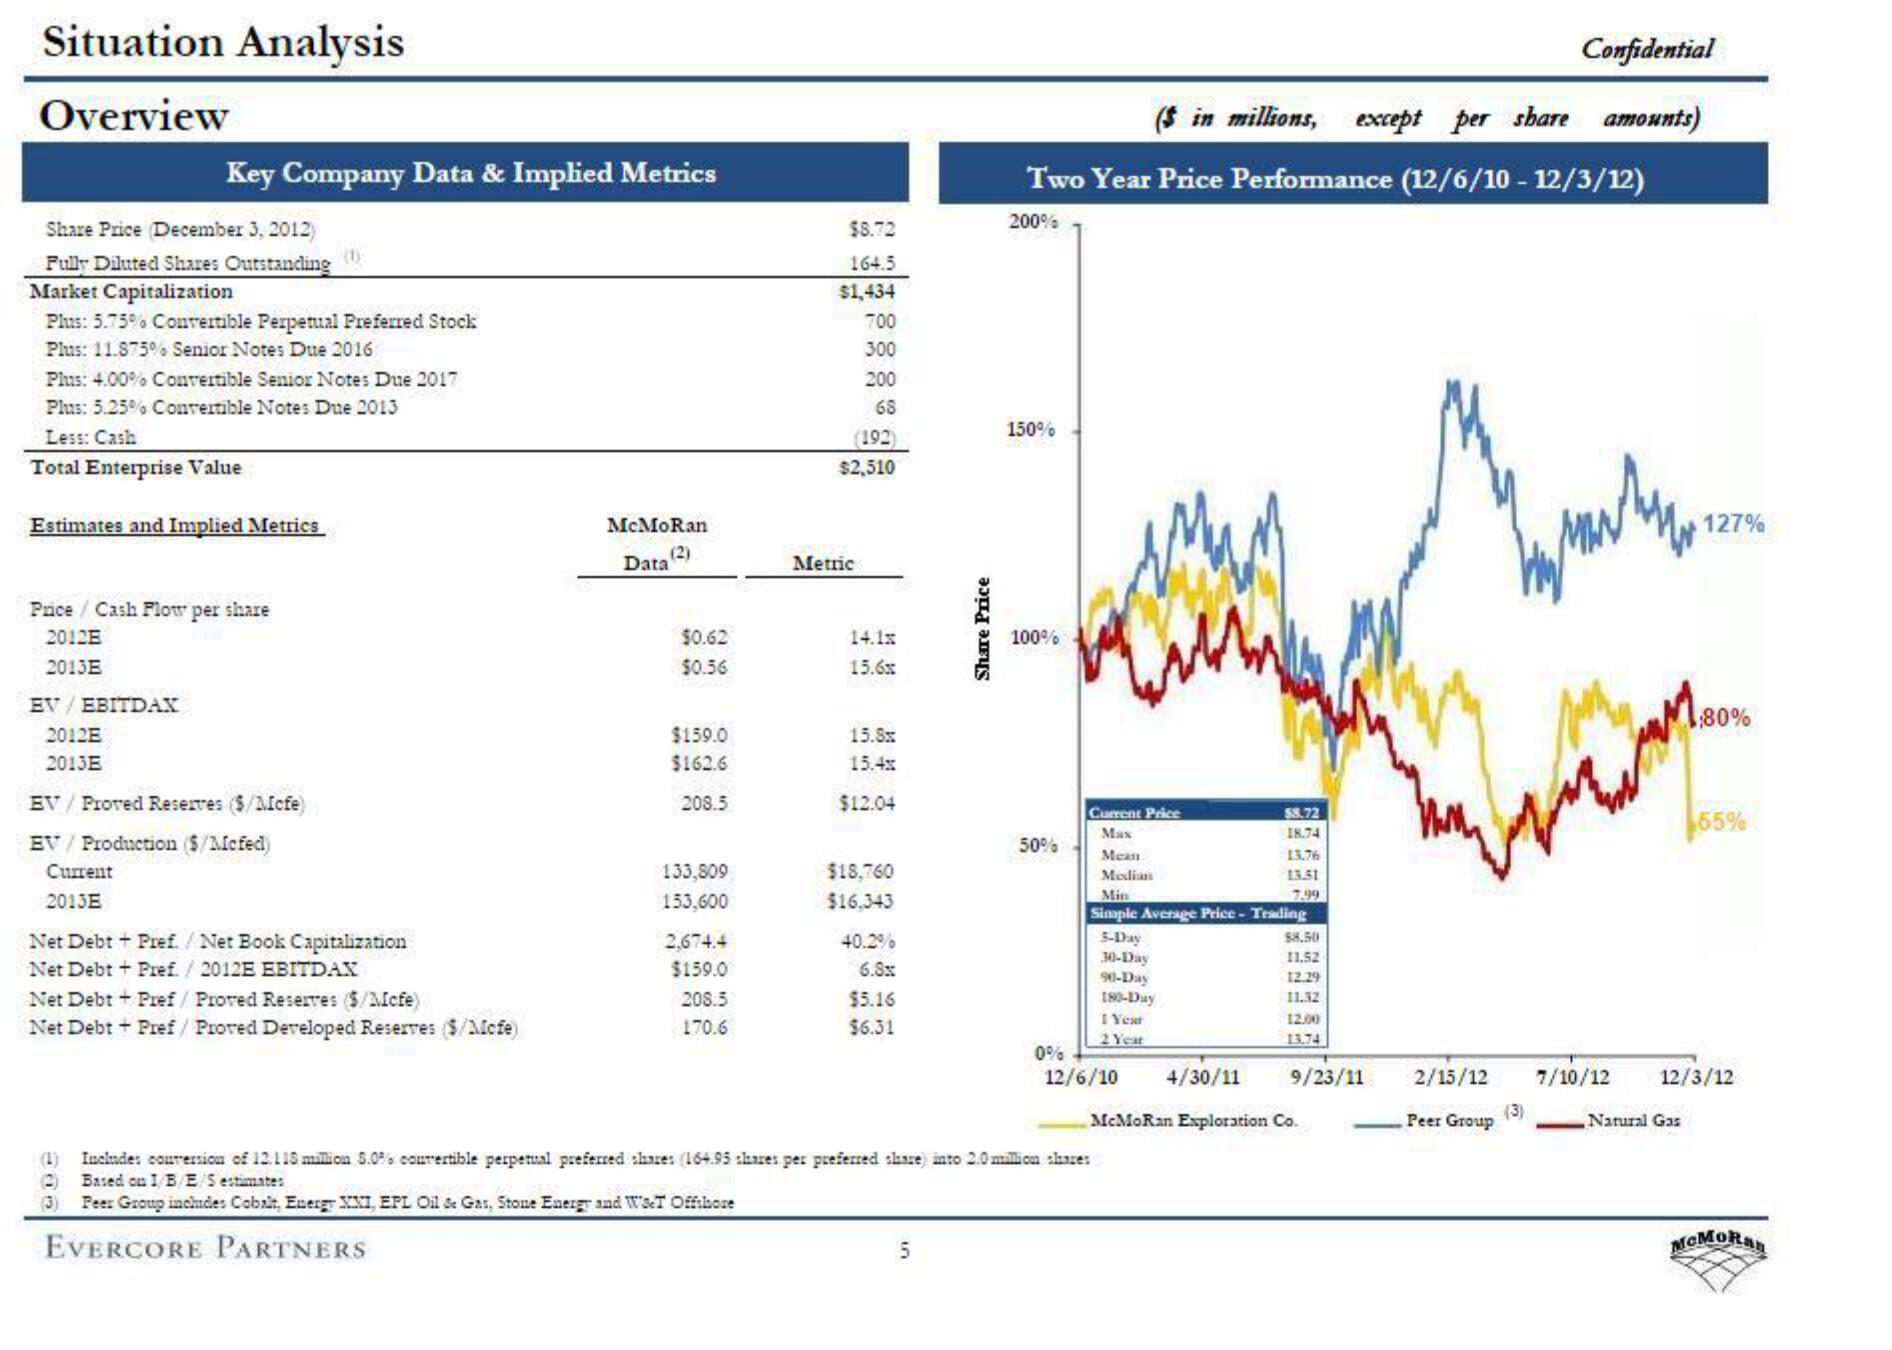
Share Price (December 3, 2012)
Fully Diluted Shares Outstanding
Market Capitalization
Plus: 5.75% Convertible Perpetual Preferred Stock
Plus: 11.875% Senior Notes Due 2016
Plus: 4.00% Convertible Senior Notes Due 2017
Plus: 5.25% Convertible Notes Due 2013
Less: Cash
Total Enterprise Value
Key Company Data & Implied Metrics
Estimates and Implied Metrics
Price Cash Flow per share
2012E
2013E
EV/EBITDAX
2012E
2013E
EV Proved Reserves ($/Mcfe)
EV/ Production ($/Mcfed)
Current
2013E
Net Debt + Pref. / Net Book Capitalization
Net Debt + Pref. / 2012E EBITDAX
Net Debt + Pref/ Proved Reserves ($/Mcfe)
Net Debt + Pref/ Proved Developed Reserves ($/Mofe)
(2)
(3)
McMoRan
(2)
Data
$0.62
$0.56
$159.0
$162.6
208.5
133,809
153,600
2,674.4
$159.0
208.5
170.6
$8.72
164.5
$1,434
700
300
200
68
(192)
$2,510
Metric
14.1x
15.6x
15.8x
15.4x
$12.04
$18,760
$16.343
40.2%
6.8x
$5.16
$6.31
in
Share Price
5
Confidential
(in millions, except per share amounts)
Two Year Price Performance (12/6/10 - 12/3/12)
200%
150%
by
100%
50%
Current Price
Max
Includes conversion of 12.115 million 5.0% convertible perpetual preferred shares (164.95 shares per preferred share) into 2.0 million shares
Based on 1/B/E/S estimates
Peer Group includes Cobalt, Energy XXI, EPL Oil & Gas, Stone Energy and W&T Offshore
EVERCORE PARTNERS
Mean
Median
$8.72
18.74
Min
Simple Average Price - Trading
5-Day
30-Day
90-Day
180-Day
1 Year
2 Year
13.76
13.51
7.99
$8.50
11.52
12.29
11.32
12.00
13.74
0%
12/6/10 4/30/11
McMoRan Exploration Co.
9/23/11
Herste
2/15/12 7/10/12
Peer Group
(3)
127%
Natural Gas
:80%
55%
12/3/12
MCMORanView entire presentation