BigCommerce Results Presentation Deck
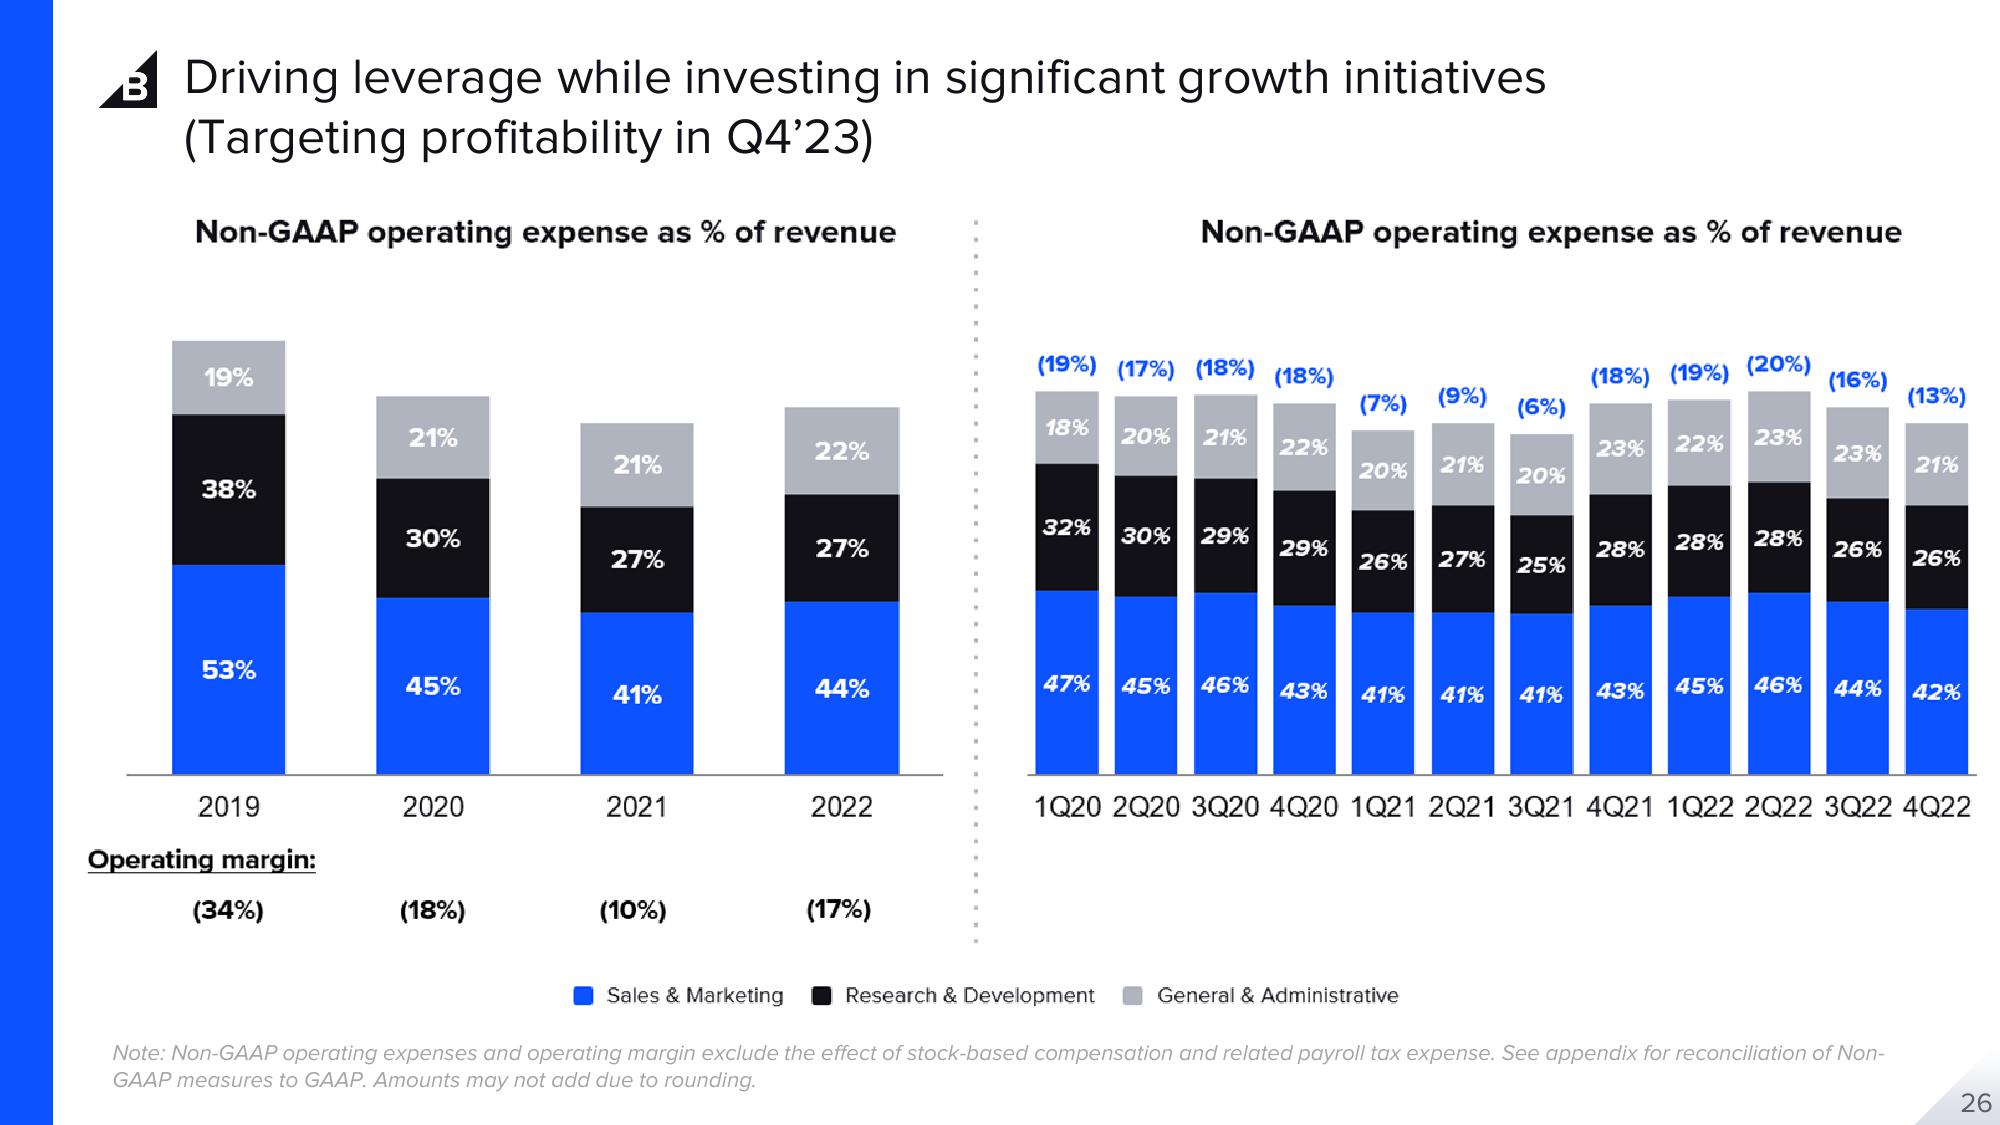
Driving leverage while investing in significant growth initiatives
(Targeting profitability in Q4'23)
Non-GAAP operating expense as % of revenue
19%
38%
53%
2019
Operating margin:
(34%)
21%
30%
45%
2020
(18%)
21%
27%
41%
2021
(10%)
22%
27%
44%
2022
(17%)
(19%) (17%) (18%) (18%)
18%
32%
Non-GAAP operating expense as % of revenue
20% 21%
30% 29%
47% 45% 46%
Research & Development
22%
29%
43%
(7%) (9%)
20% 21%
41%
26% 27% 25%
(6%)
41%
20%
General & Administrative
(18%) (19%) (20%)
23% 22%
28% 28%
41% 43%
23%
28%
(16%)
46%
45%
23%
26%
Sales & Marketing
Note: Non-GAAP operating expenses and operating margin exclude the effect of stock-based compensation and related payroll tax expense. See appendix for reconciliation of Non-
GAAP measures to GAAP. Amounts may not add due to rounding.
(13%)
21%
1Q20 2Q20 3Q20 4Q20 1Q21 2Q21 3Q21 4Q21 1Q22 2Q22 3Q22 4Q22
26%
44% 42%
26View entire presentation