Fastly Investor Presentation Deck
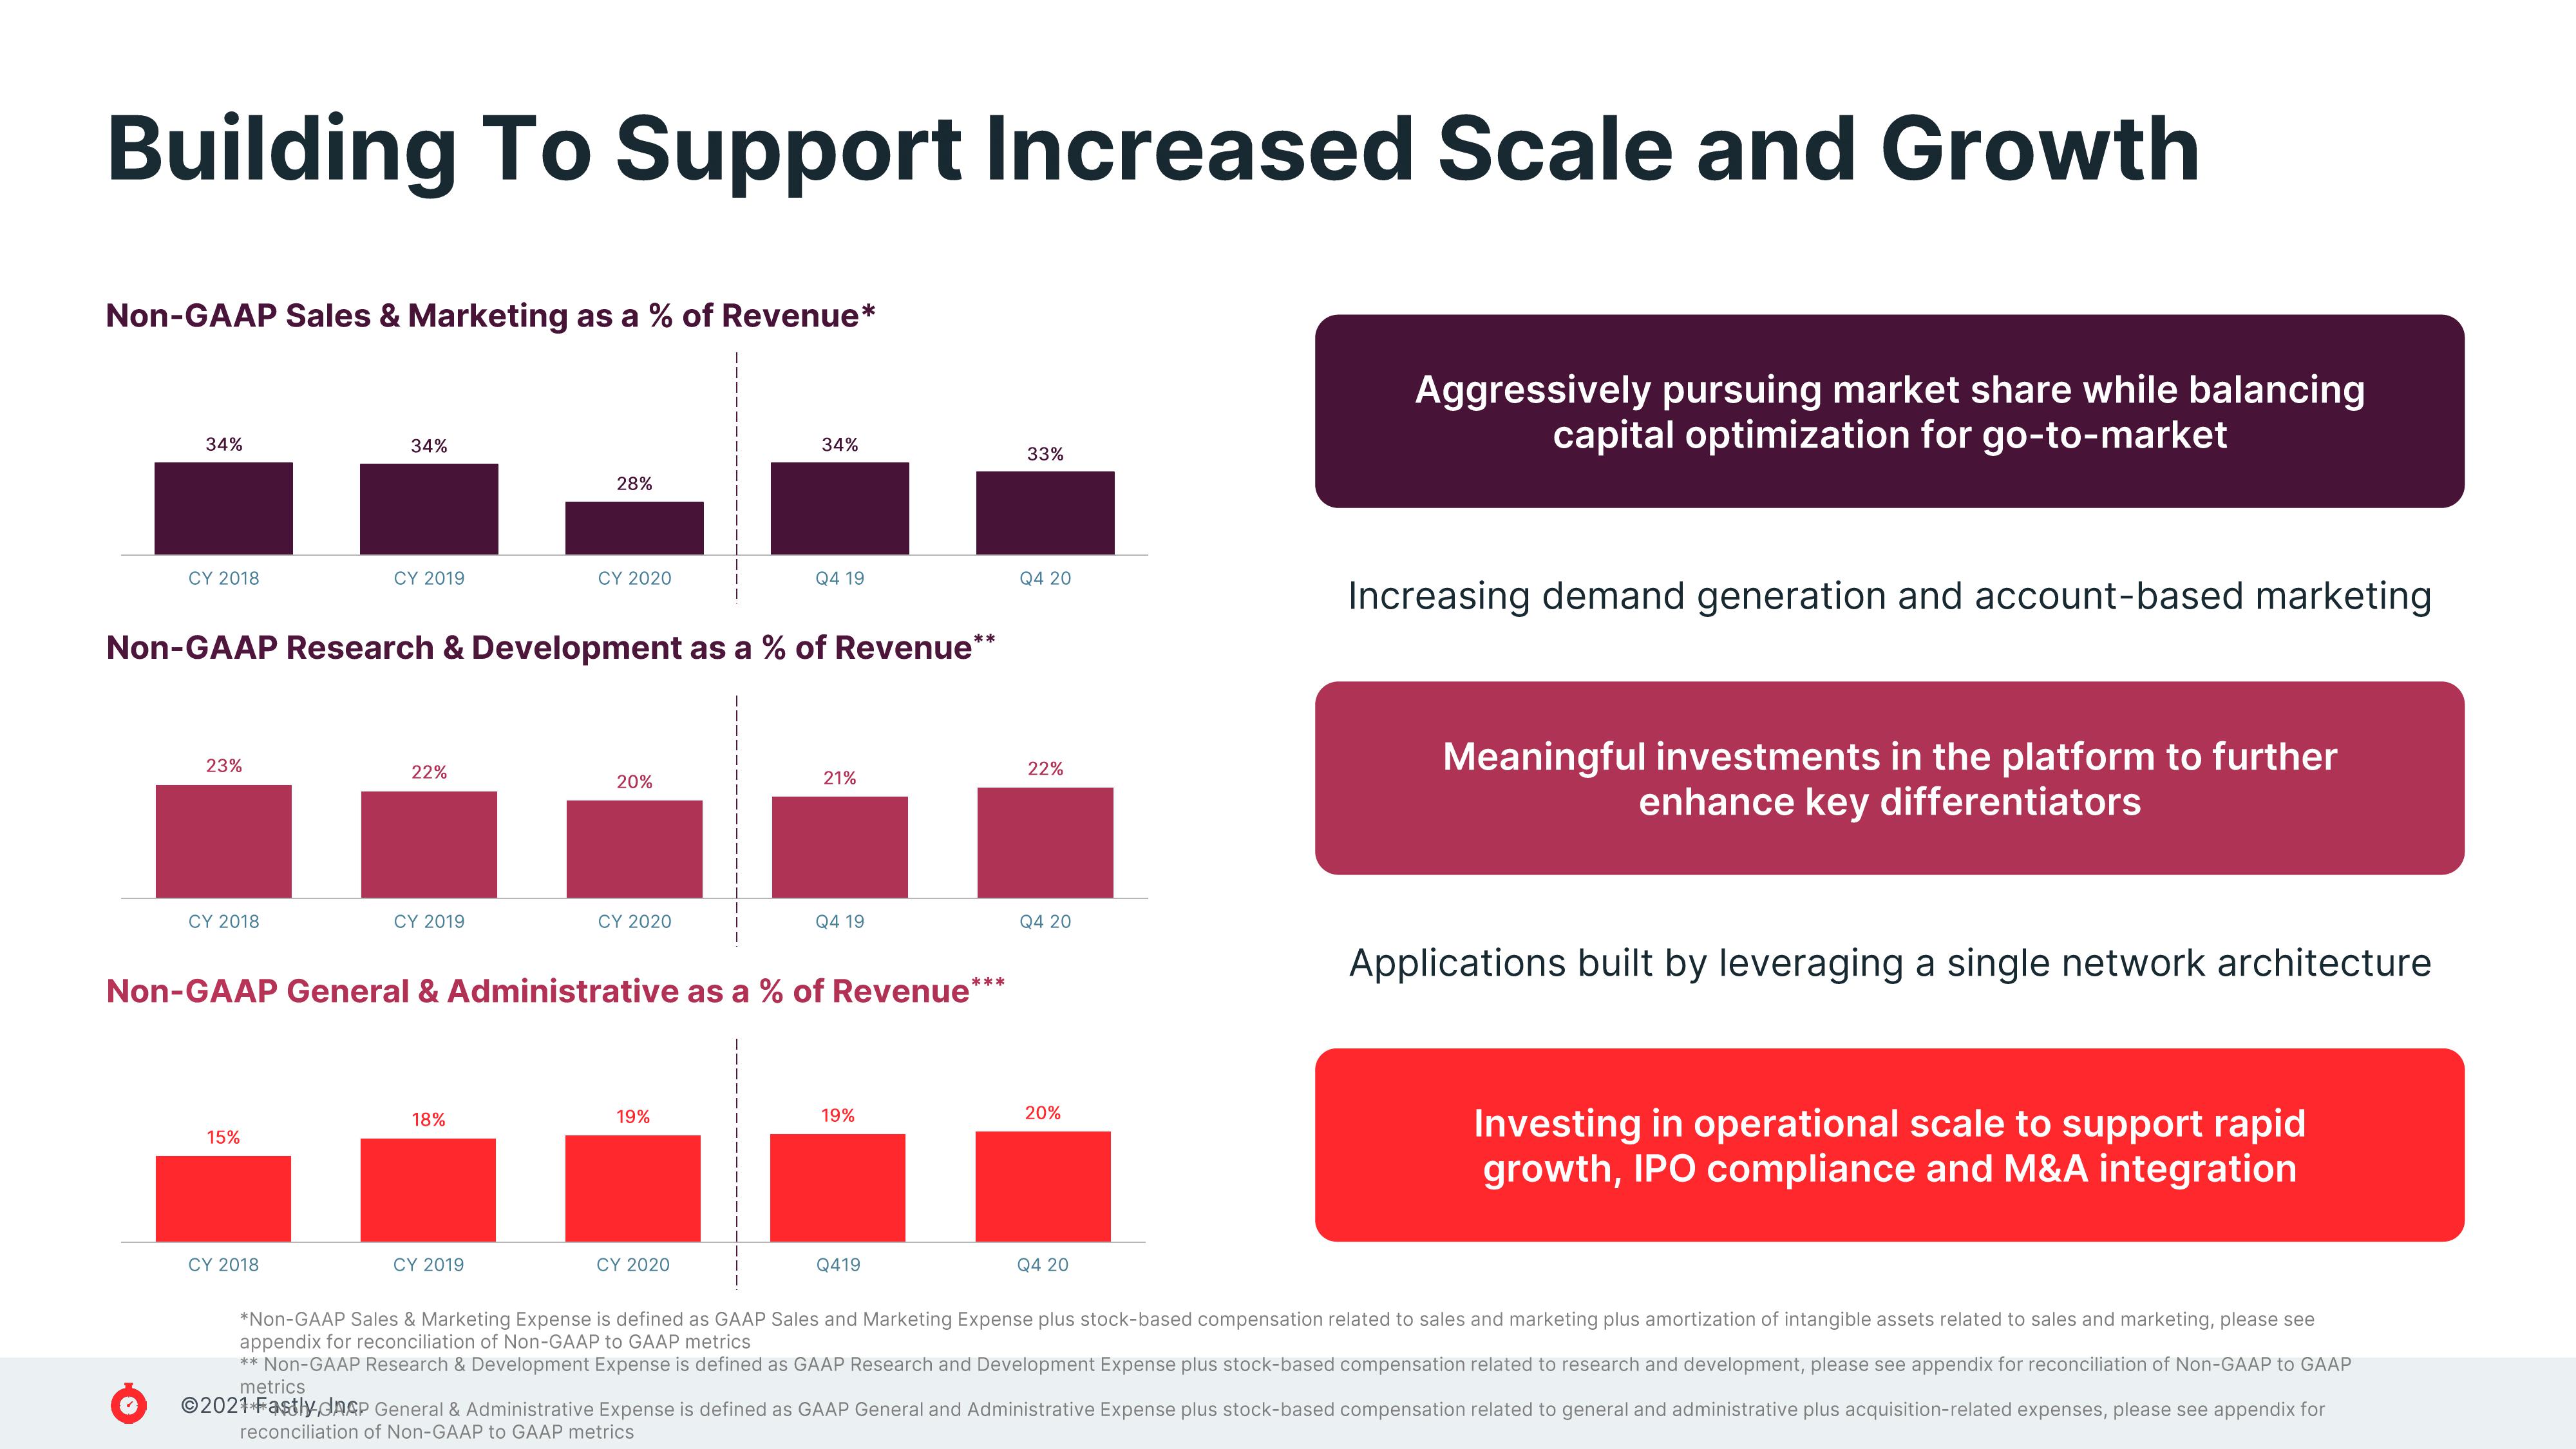
Building To Support Increased Scale and Growth
Non-GAAP Sales & Marketing as a % of Revenue*
34%
CY 2018
23%
CY 2018
34%
15%
CY 2019
CY 2018
Non-GAAP Research & Development as a % of Revenue**
22%
CY 2019
28%
18%
CY 2020
CY 2019
20%
CY 2020
34%
Non-GAAP General & Administrative as a % of Revenue**
19%
Q4 19
CY 2020
21%
Q4 19
19%
***
Q419
33%
Q4 20
22%
Q4 20
20%
Q4 20
Aggressively pursuing market share while balancing
capital optimization for go-to-market
Increasing demand generation and account-based marketing
Meaningful investments in the platform to further
enhance key differentiators
Applications built by leveraging a single network architecture
Investing in operational scale to support rapid
growth, IPO compliance and M&A integration
*Non-GAAP Sales & Marketing Expense is defined as GAAP Sales and Marketing Expense plus stock-based compensation related to sales and marketing plus amortization of intangible assets related to sales and marketing, please see
appendix for reconciliation of Non-GAAP to GAAP metrics
** Non-GAAP Research & Development Expense is defined as GAAP Research and Development Expense plus stock-based compensation related to research and development, please see appendix for reconciliation of Non-GAAP to GAAP
metrics
Ⓒ2021 Fastly.dneP General & Administrative Expense is defined as GAAP General and Administrative Expense plus stock-based compensation related to general and administrative plus acquisition-related expenses, please see appendix for
reconciliation of Non-GAAP to GAAP metricsView entire presentation