Twitter Results Presentation Deck
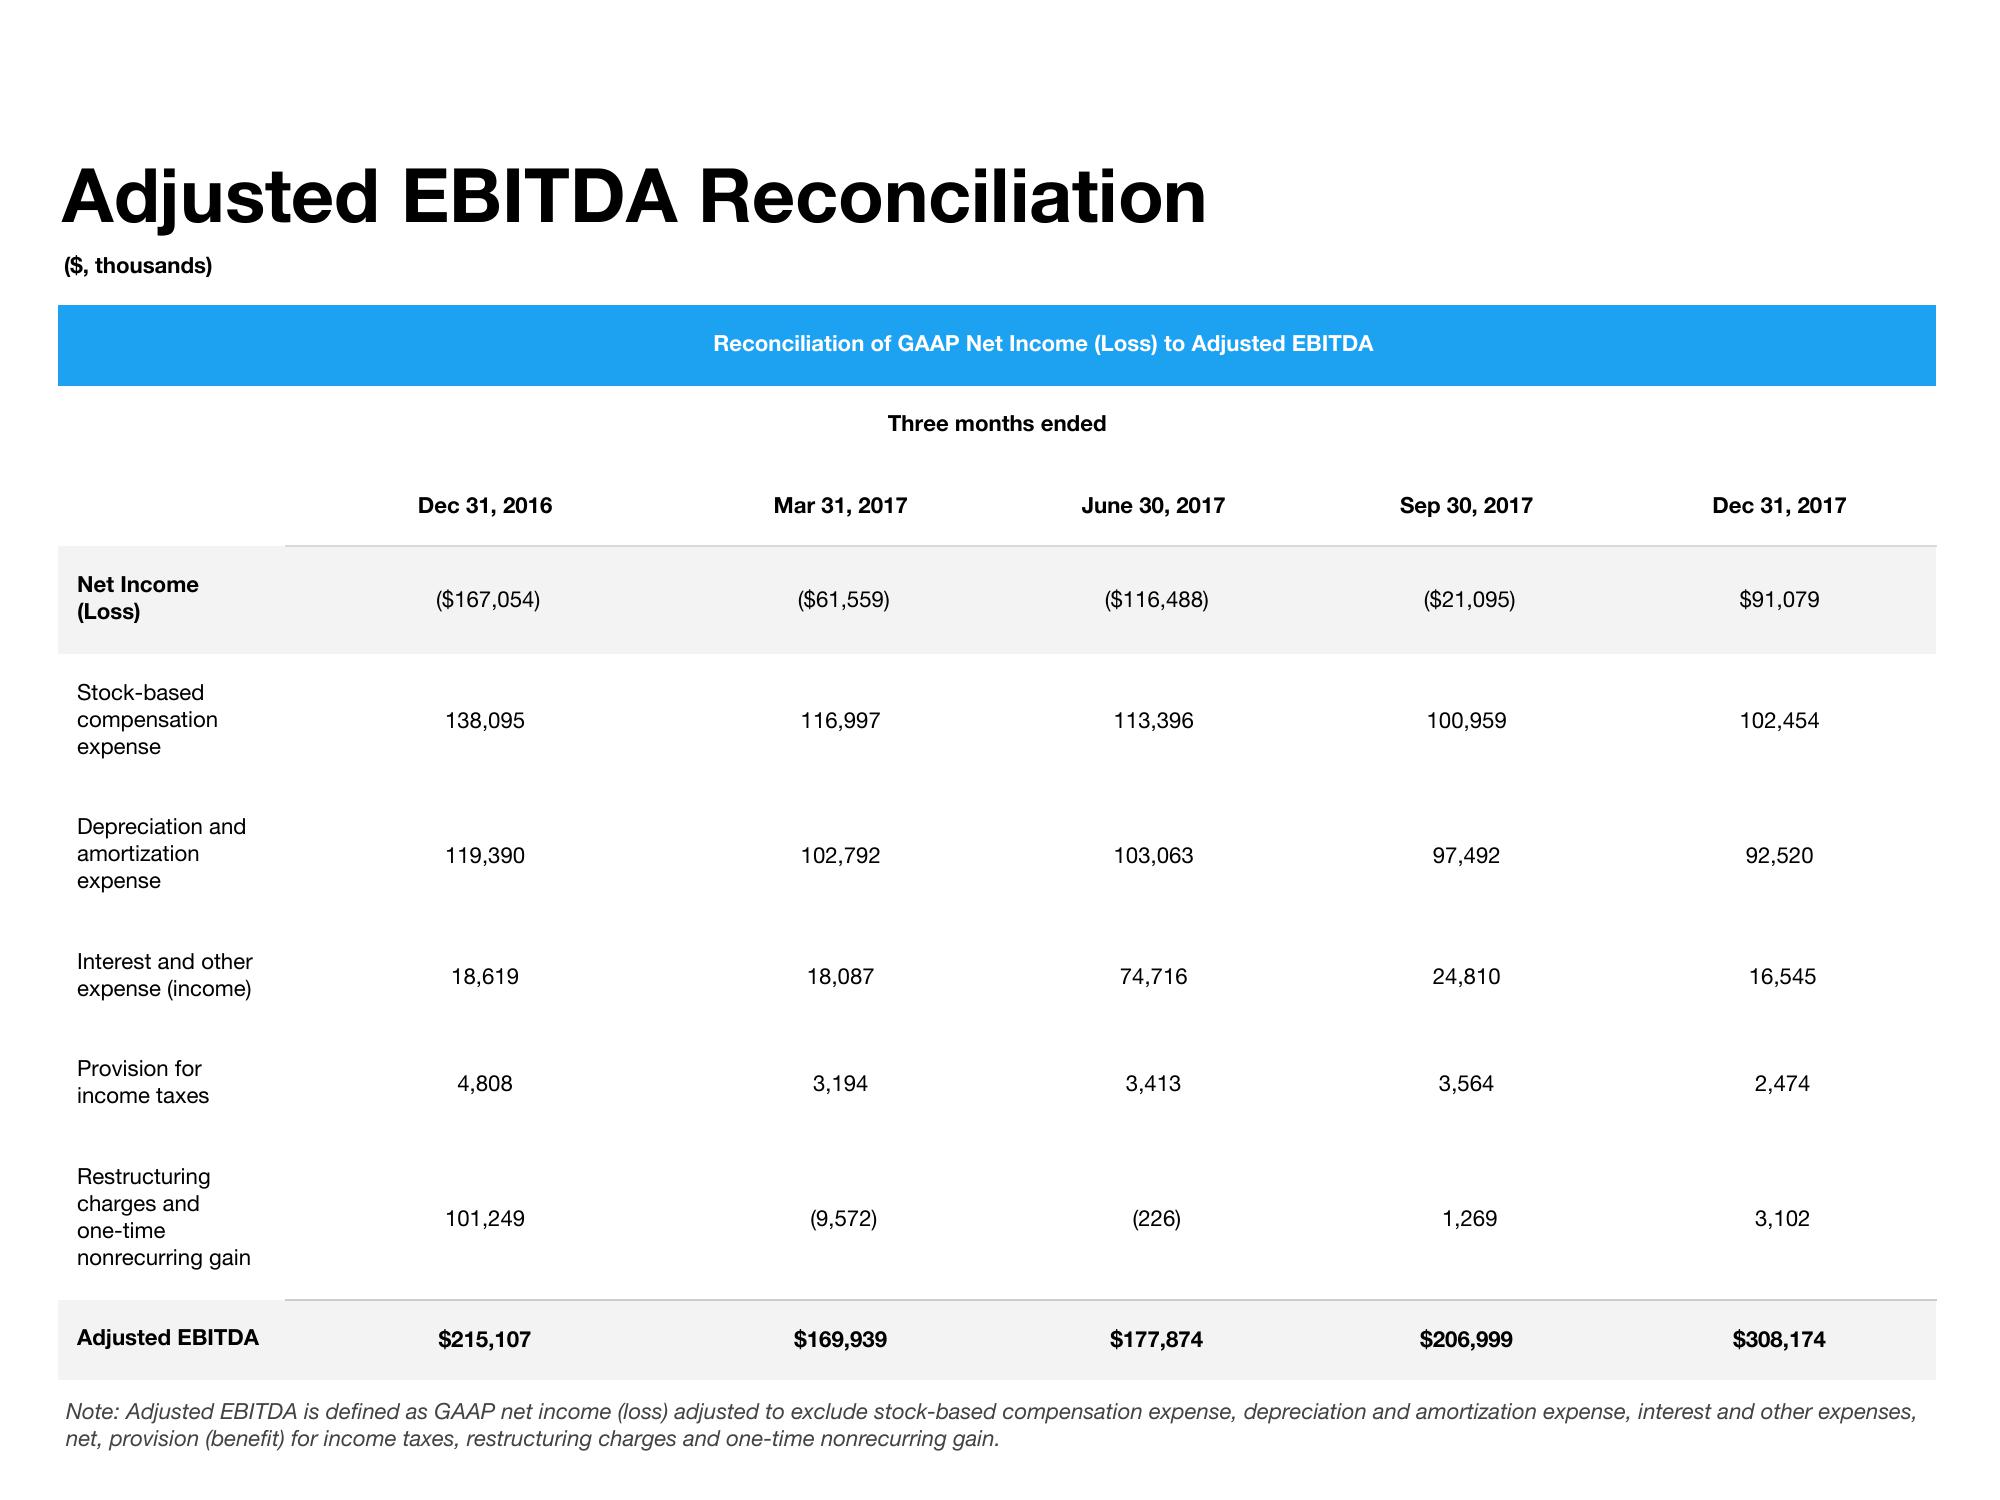
Adjusted EBITDA Reconciliation
($, thousands)
Net Income
(Loss)
Stock-based
compensation
expense
Depreciation and
amortization
expense
Interest and other
expense (income)
Provision for
income taxes
Restructuring
charges and
one-time
nonrecurring gain
Adjusted EBITDA
Dec 31, 2016
($167,054)
138,095
119,390
18,619
4,808
101,249
$215,107
Reconciliation of GAAP Net Income (Loss) to Adjusted EBITDA
Mar 31, 2017
($61,559)
116,997
102,792
18,087
3,194
Three months ended
(9,572)
$169,939
June 30, 2017
($116,488)
113,396
103,063
74,716
3,413
(226)
$177,874
Sep 30, 2017
($21,095)
100,959
97,492
24,810
3,564
1,269
$206,999
Dec 31, 2017
$91,079
102,454
92,520
16,545
2,474
3,102
$308,174
Note: Adjusted EBITDA is defined as GAAP net income (loss) adjusted to exclude stock-based compensation expense, depreciation and amortization expense, interest and other expenses,
net, provision (benefit) for income taxes, restructuring charges and one-time nonrecurring gain.View entire presentation