MariaDB SPAC Presentation Deck
INCOME STATEMENT DETAIL
($ in millions)
Total ARR
Growth %
Revenue:
Product Subscription
Services & Other
Total Revenue
Growth %
Gross Profit
Gross Margin %
Sales & Marketing
Engineering
Other G&A
Total Operating Expenses (Incl. D&A)
Sales & Marketing % of Revenue
Engineering % of Revenue
Other G&A % of Revenue
Total Operating Expenses % of Revenue
Operating Income
1
FY20A
$30.6
18%
$26.4
4.3
$30.7
18%
$22.4
73%
$18.3
15.9
8.6
$42.8
60%
52%
28%
140%
($20.4)
FY21A
$40.3
31%
$31.5
3.2
$34.7
13%
$25.4
73%
$18.1
24.8
9.0
$52.0
52%
71%
26%
150%
($26.6)
Note: Assumes USD:EUR conversion of 1.15:1.00
Note: FYE is September 30th
(1) Calculated as Gross Profit less Total Operating Expenses (Incl. Depreciation & Amortization).
Proprietary & Confidential
FY22P
$53.4
33%
$43.7
3.7
$47.4
37%
$34.1
72%
$30.2
37.2
9.9
$77.3
64%
78%
21%
163%
($43.2)
FY23P
$72.3
35%
$58.9
4.6
$63.5
34%
$44.4
70%
$39.2
39.2
10.7
$89.1
62%
62%
17%
140%
($44.7)
●
•
●
●
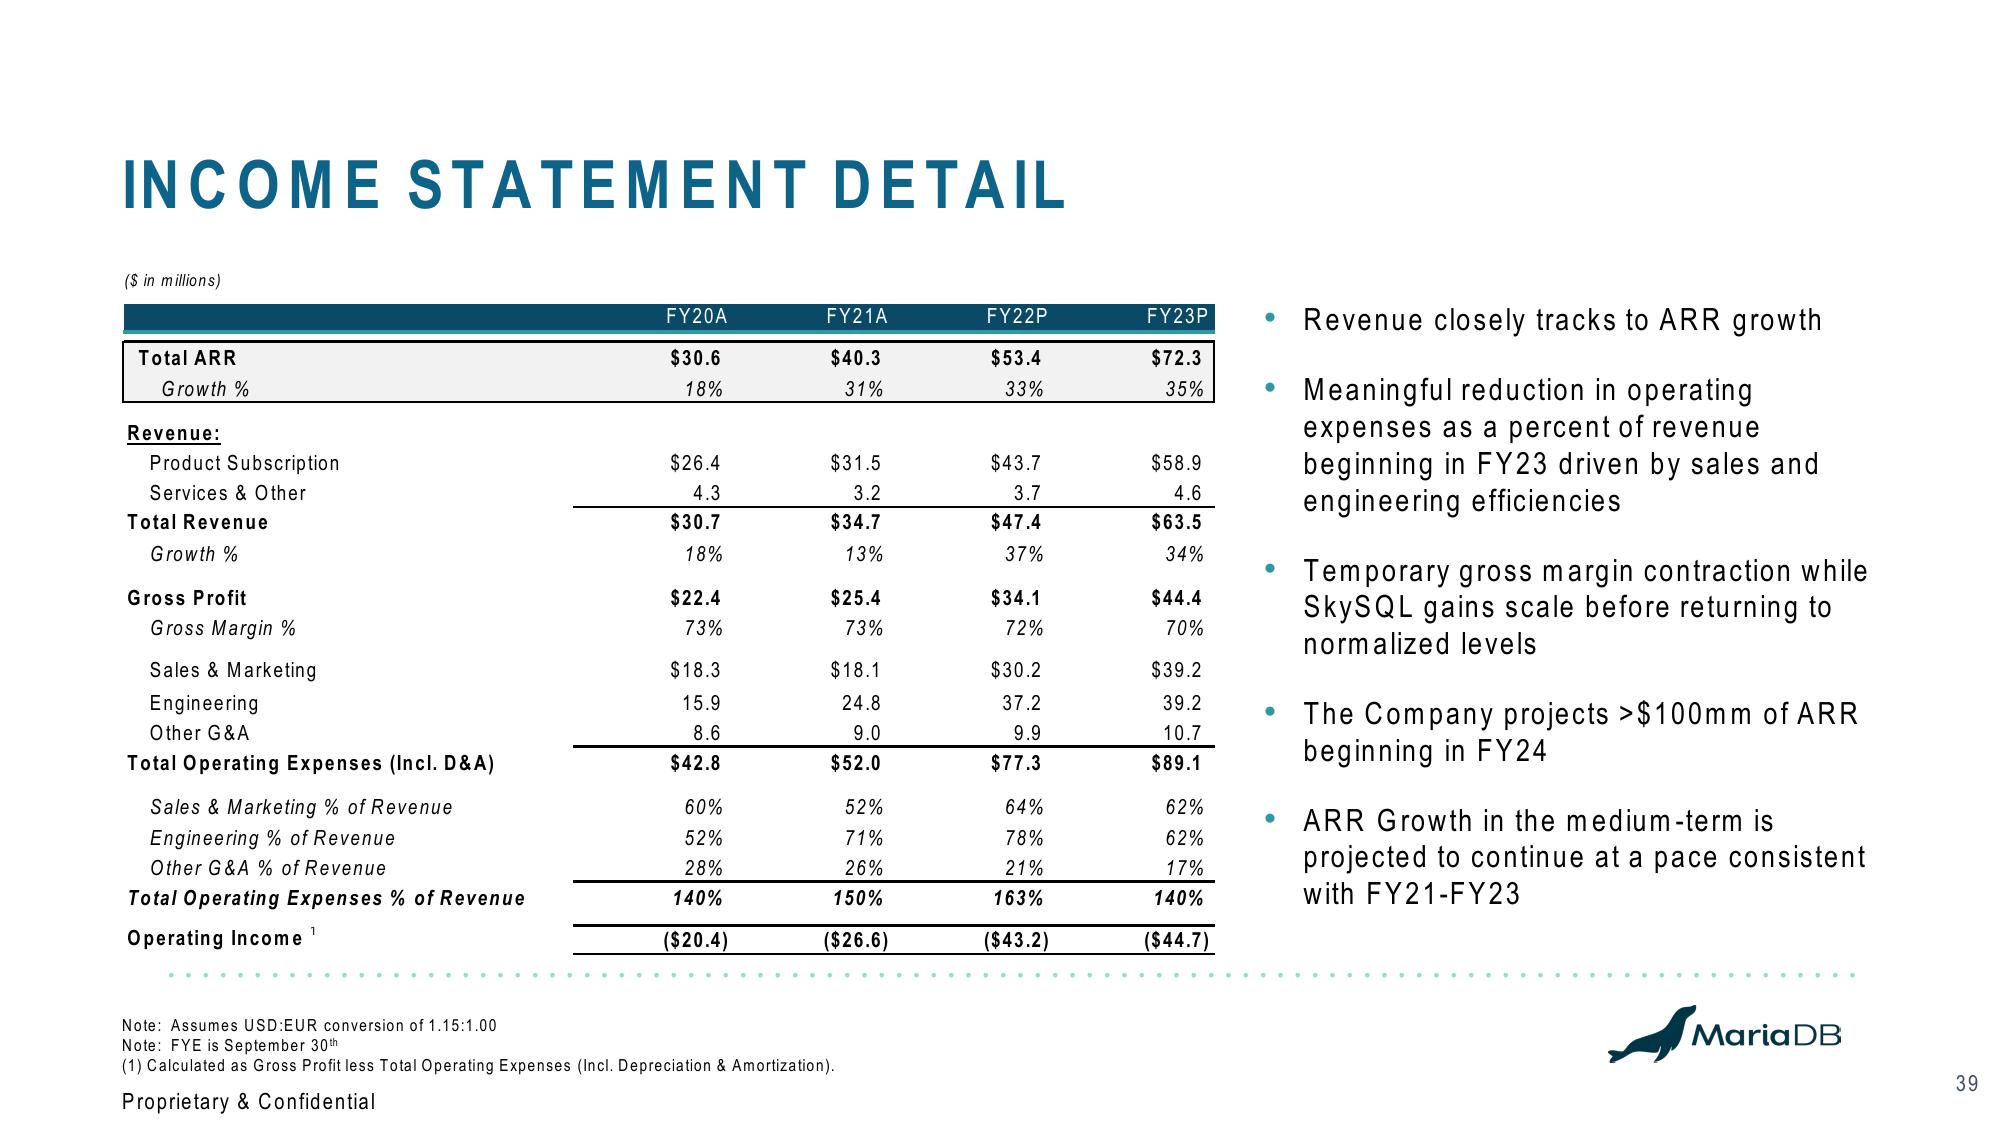
Revenue closely tracks to ARR growth
Meaningful reduction in operating
expenses as a percent of revenue
beginning in FY23 driven by sales and
engineering efficiencies
Temporary gross margin contraction while
SkySQL gains scale before returning to
normalized levels
The Company projects >$100mm of ARR
beginning in FY24
ARR Growth in the medium-term is
projected to continue at a pace consistent
with FY21-FY23
MariaDB
39View entire presentation