Credit Suisse Investment Banking Pitch Book
CONFIDENTIAL
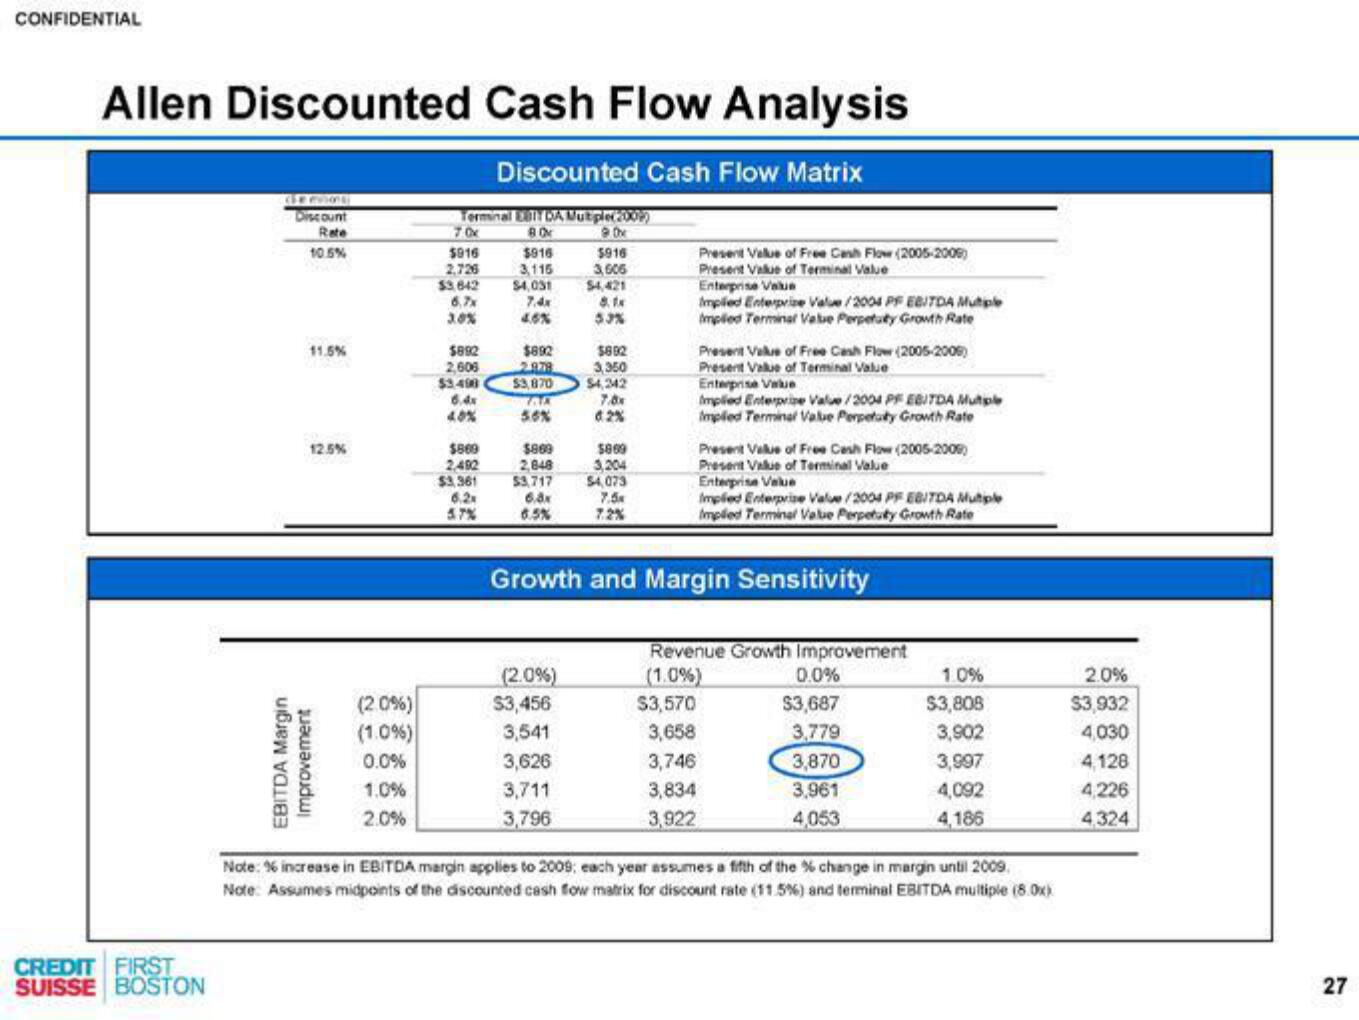
Allen Discounted Cash Flow Analysis
Discounted Cash Flow Matrix
Terminal EBIT DA Multiple(2009)
80%
9 the
CREDIT FIRST
SUISSE BOSTON
GENRE
Discount
Rate
10.5%
11.5%
12.5%
EBITDA Margin
Improvement
(2.0%)
(1.0%)
0.0%
1.0%
2.0%
70x
$916
2,726
$3.642
6.7x
30%
$892
2,606
$3.498
6.4x
40%
$869
2,492
$3,361
5.7%
$916
3,115
$4,031
7.4x
4.6%
$892
2978
$3,870
LAR
56%
$916
3,606
$4,421
8.1x
5.3%
(2.0%)
$892
3,350
$869
$869
2,848
3,204
53,717 $4,073
6.8x
7.5x
6.5%
7.2%
$3,456
3,541
3,626
3,711
3,796
$4,242
7.8x
62%
Present Value of Free Cash Flow (2005-2006)
Present Value of Terminal Value
Enterprise Value
Implied Enterprise Value/2004 PF EBITDA Multiple
Implied Terminal Value Perpetuty Growth Rate
Present Value of Free Cash Flow (2005-2006)
Present Value of Terminal Value
Enterprise Value
Implied Enterprise Value/2004 PF EBITDA Multiple
Implied Terminal Value Perpetuty Growth Rate
Present Value of Free Cash Flow (2005-2006)
Present Value of Terminal Value
Growth and Margin Sensitivity
Enterprise Value
Implied Enterprise Value/2004 PF EBITDA Mutiple
Implied Terminal Value Perpetuty Growth Rate
Revenue Growth Improvement
(1.0%)
$3,570
3,658
3,746
3,834
3,922
0.0%
$3,687
3,779
3,870
3,961
4,053
1.0%
$3,808
3,902
3,997
4,092
4,186
Note: % increase in EBITDA margin applies to 2009: each year assumes a fifth of the % change in margin until 2009.
Note: Assumes midpoints of the discounted cash fow matrix for discount rate (11.5%) and terminal EBITDA multiple (8.0x)
2.0%
$3,932
4,030
4,128
4,226
4,324
27View entire presentation