J.P.Morgan Results Presentation Deck
JPMORGAN CHASE & CO.
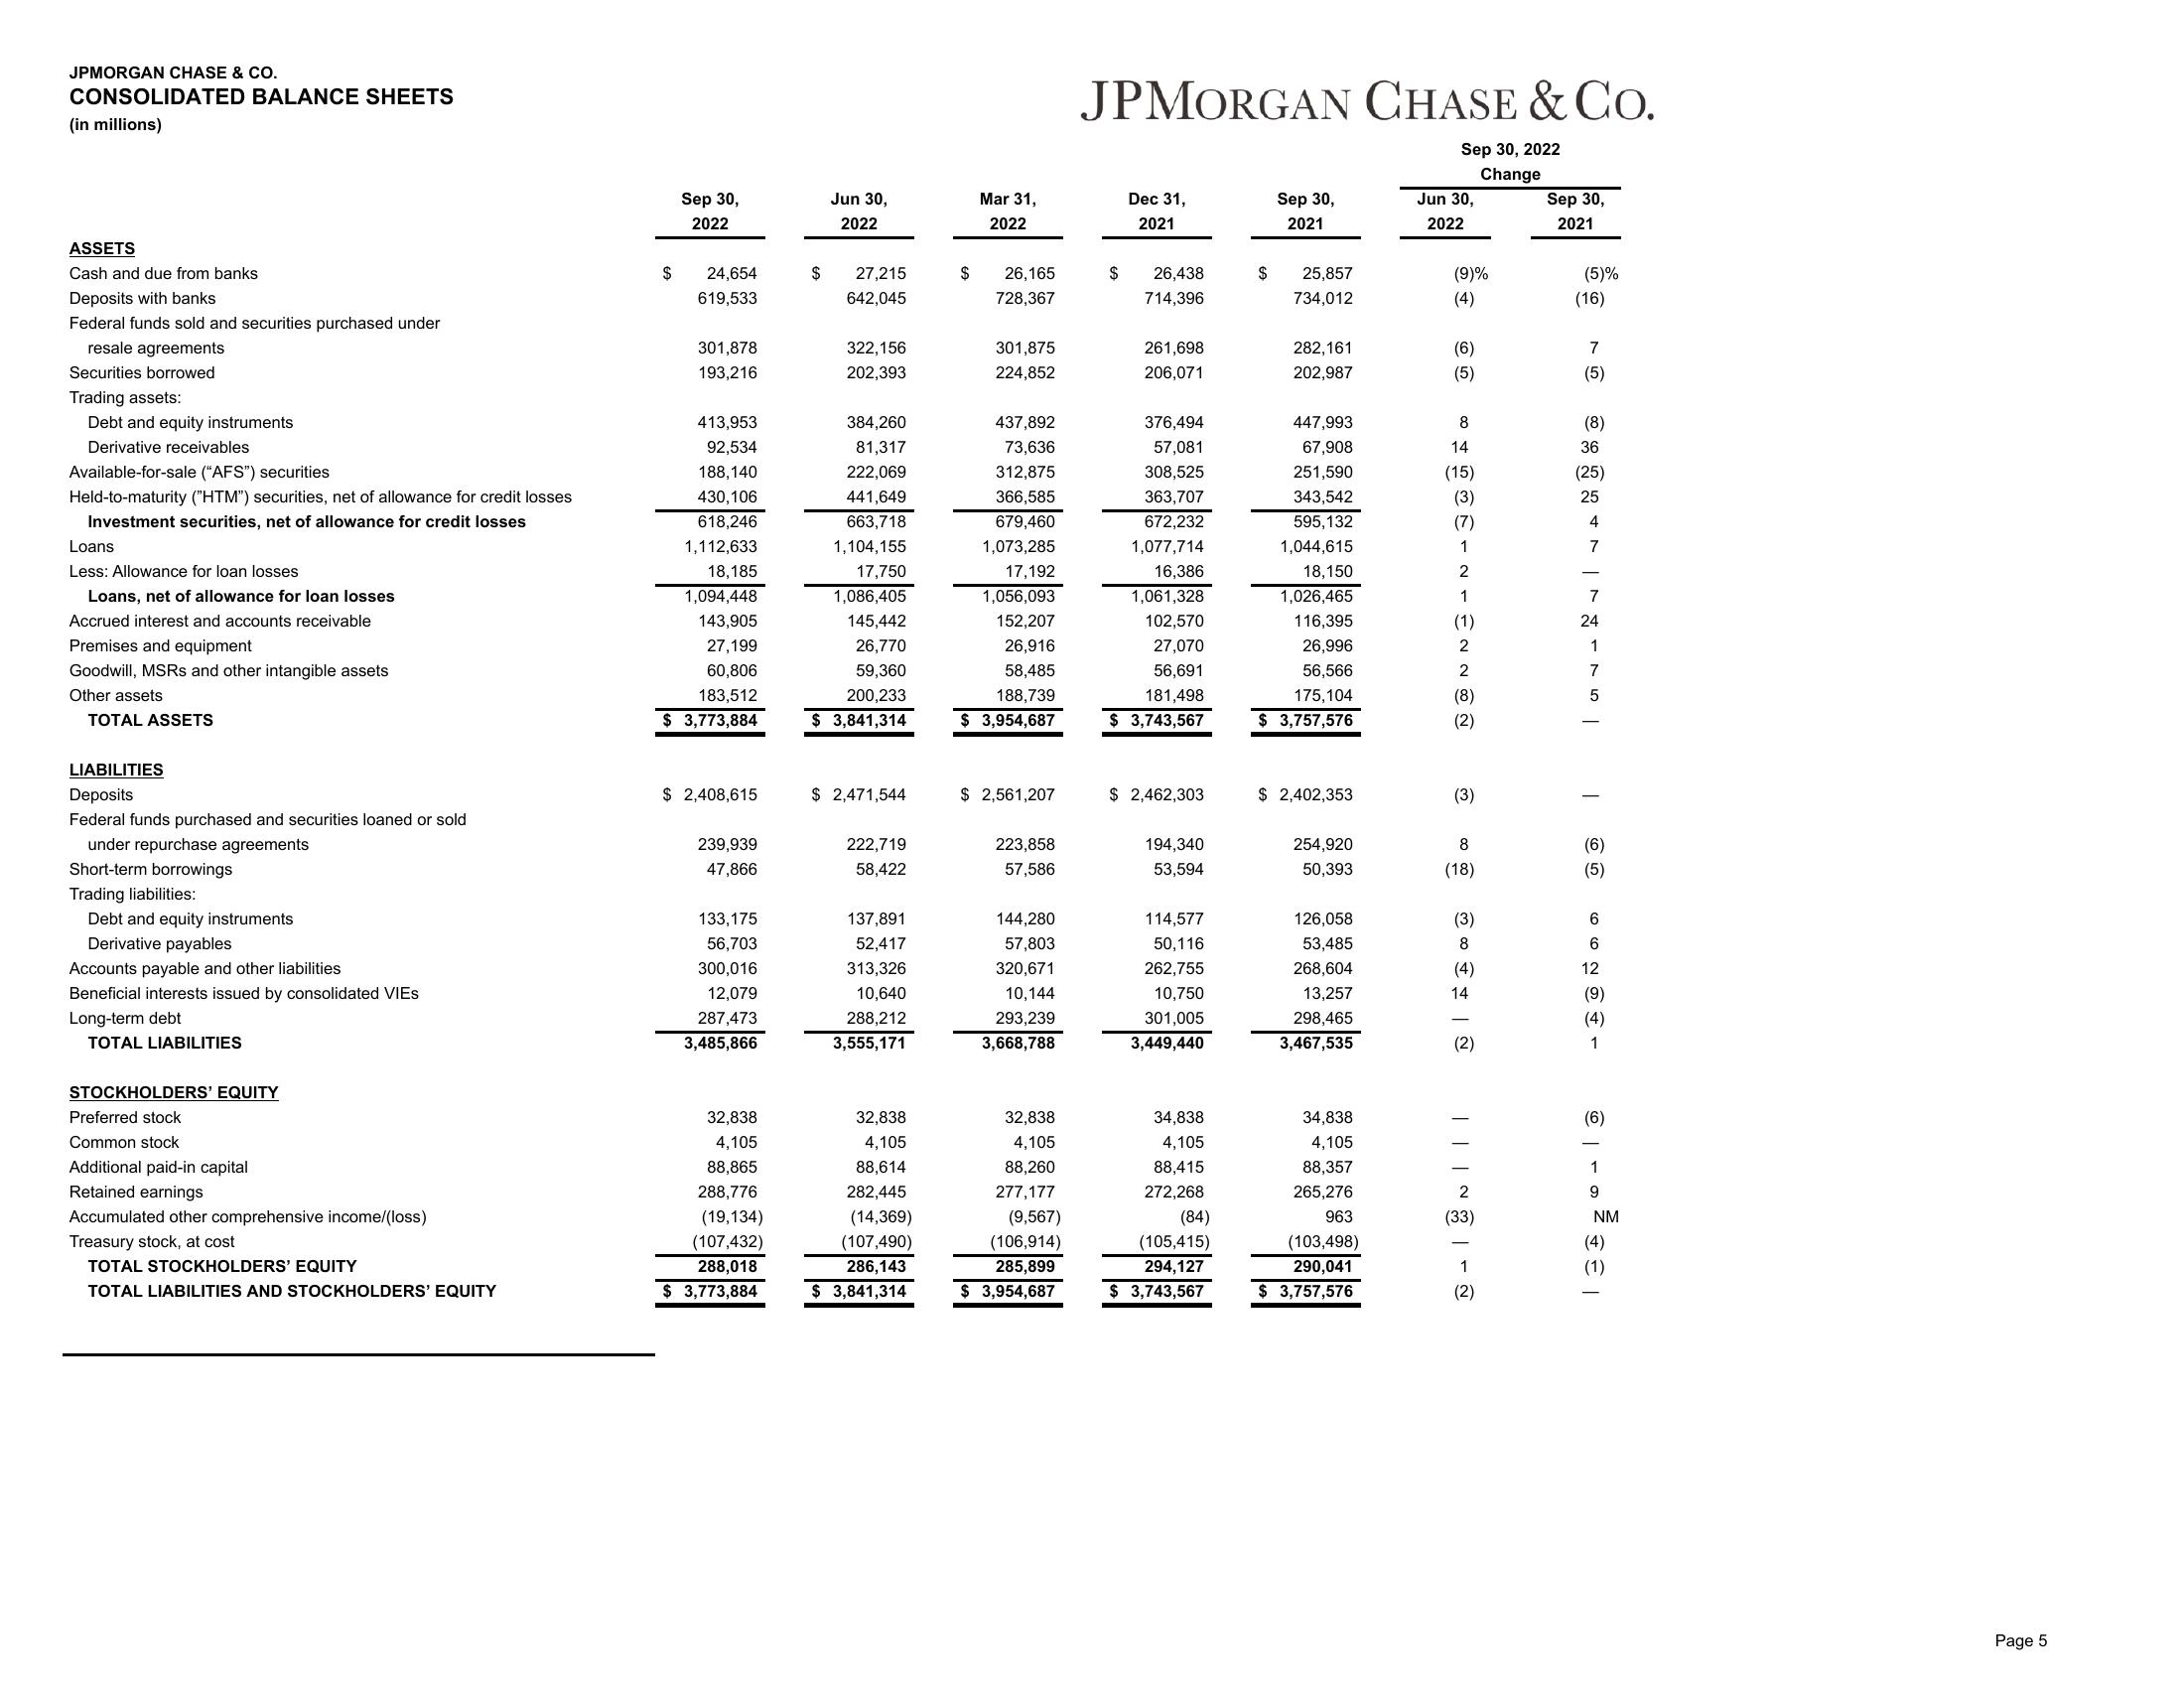
CONSOLIDATED BALANCE SHEETS
(in millions)
ASSETS
Cash and due from banks
Deposits with banks
Federal funds sold and securities purchased under
resale agreements
Securities borrowed
Trading assets:
Debt and equity instruments
Derivative receivables
Available-for-sale ("AFS") securities
Held-to-maturity ("HTM") securities, net of allowance for credit losses
Investment securities, net of allowance for credit losses
Loans
Less: Allowance for loan losses
Loans, net of allowance for loan losses
Accrued interest and accounts receivable
Premises and equipment
Goodwill, MSRs and other intangible assets
Other assets
TOTAL ASSETS
LIABILITIES
Deposits
Federal funds purchased and securities loaned or sold
under repurchase agreements
Short-term borrowings
Trading liabilities:
Debt and equity instruments
Derivative payables
Accounts payable and other liabilities
Beneficial interests issued by consolidated VIES
Long-term debt
TOTAL LIABILITIES
STOCKHOLDERS' EQUITY
Preferred stock
Common stock
Additional paid-in capital
Retained earnings
Accumulated other comprehensive income/(loss)
Treasury stock, at cost
TOTAL STOCKHOLDERS' EQUITY
TOTAL LIABILITIES AND STOCKHOLDERS' EQUITY
$
Sep 30,
2022
24,654
619,533
301,878
193,216
413,953
92,534
188,140
430,106
618,246
1,112,633
18,185
1,094,448
143,905
27,199
60,806
183,512
$ 3,773,884
$ 2,408,615
239,939
47,866
133,175
56,703
300,016
12,079
287,473
3,485,866
32,838
4,105
88,865
288,776
(19,134)
(107,432)
288,018
$ 3,773,884
$
Jun 30,
2022
27,215
642,045
322,156
202,393
384,260
81,317
222,069
441,649
663,718
1,104,155
17,750
1,086,405
145,442
26,770
59,360
200,233
$ 3,841,314
$ 2,471,544
222,719
58,422
137,891
52,417
313,326
10,640
288,212
3,555,171
32,838
4,105
88,614
282,445
(14,369)
(107,490)
286,143
$ 3,841,314
$
Mar 31,
2022
26,165
728,367
301,875
224,852
437,892
73,636
312,875
366,585
679,460
1,073,285
17,192
1,056,093
152,207
26,916
58,485
188,739
$ 3,954,687
$ 2,561,207
223,858
57,586
144,280
57,803
320,671
10,144
293,239
3,668,788
32,838
4,105
88,260
277,177
(9,567)
(106,914)
285,899
$ 3,954,687
JPMORGAN CHASE & CO.
Sep 30, 2022
Change
$
Dec 31,
2021
26,438
714,396
261,698
206,071
376,494
57,081
308,525
363,707
672,232
1,077,714
16,386
1,061,328
102,570
27,070
56,691
181,498
$ 3,743,567
$ 2,462,303
194,340
53,594
114,577
50,116
262,755
10,750
301,005
3,449,440
34,838
4,105
88,415
272,268
(84)
(105,415)
294,127
$ 3,743,567
$
Sep 30,
2021
25,857
734,012
282,161
202,987
447,993
67,908
251,590
343,542
595,132
1,044,615
18,150
1,026,465
116,395
26,996
56,566
175,104
$ 3,757,576
$ 2,402,353
254,920
50,393
126,058
53,485
268,604
13,257
298,465
3,467,535
34,838
4,105
88,357
265,276
963
(103,498)
290,041
$ 3,757,576
Jun 30,
2022
(9)%
(4)
(6)
(5)
(15)
(3)
E-N-ENNON
(3)
8
(18)
(3)
8
(4)
14
(2)
| | |~ | - ~
(33)
(2)
Sep 30,
2021
(5)%
(16)
7
(5)
(8)
36
(25)
25
4
7
7
24
1
7
5
I
(6)
(5)
6
6
12
(9)
(4)
1
(6)
1
9
NM
(4)
(1)
Page 5View entire presentation