WeWork SPAC Presentation Deck
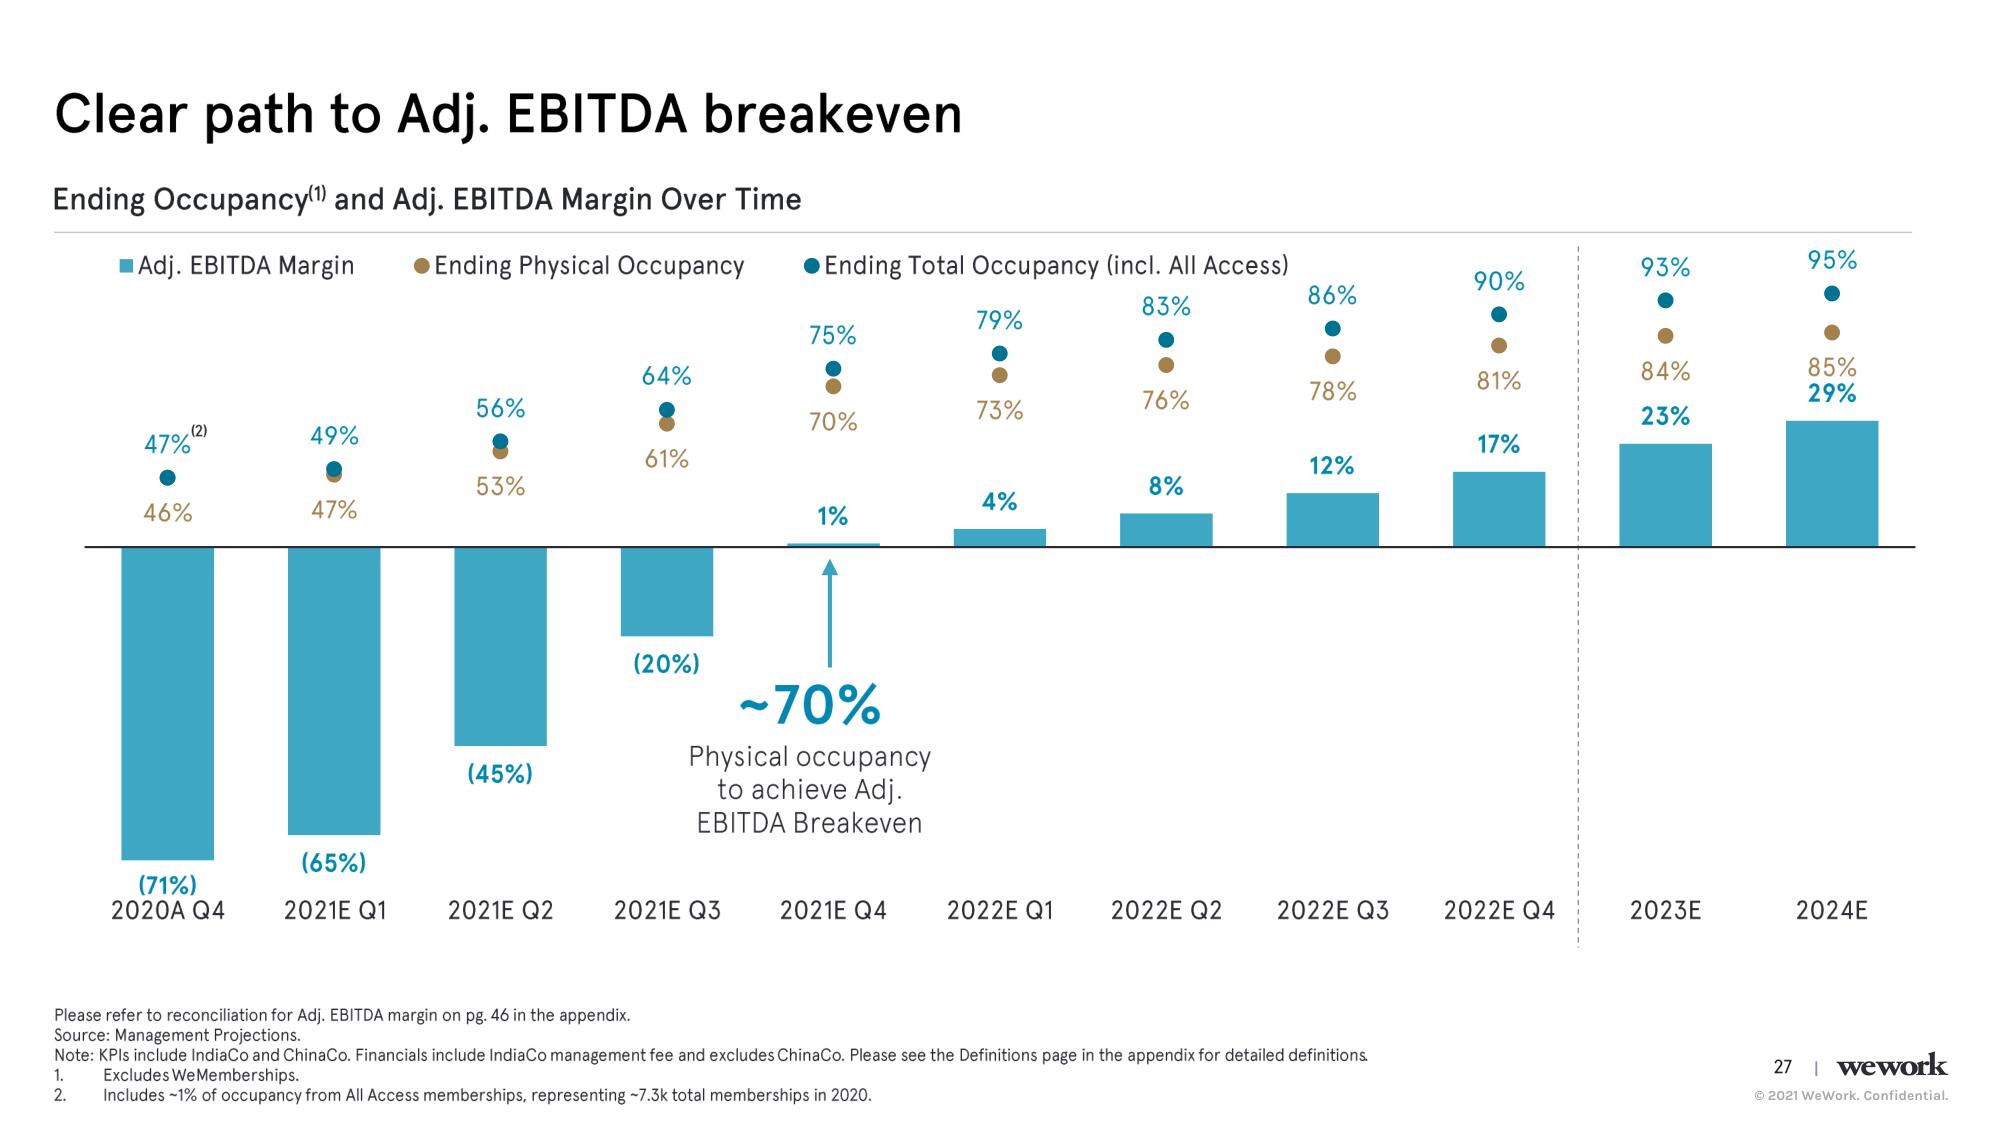
Clear path to Adj. EBITDA breakeven
Ending Occupancy(1) and Adj. EBITDA Margin Over Time
Adj. EBITDA Margin
Ending Physical Occupancy
(2)
47%2
46%
(71%)
2020A Q4
49%
47%
(65%)
2021E Q1
56%
53%
(45%)
2021E Q2
64%
61%
(20%)
Ending Total Occupancy (incl. All Access)
83%
2021E Q3
75%
70%
1%
-70%
Physical occupancy
to achieve Adj.
EBITDA Breakeven
2021E Q4
79%
73%
4%
2022E Q1
76%
8%
2022E Q2
86%
78%
12%
2022E Q3
Please refer to reconciliation for Adj. EBITDA margin on pg. 46 in the appendix.
Source: Management Projections.
Note: KPIs include IndiaCo and ChinaCo. Financials include IndiaCo management fee and excludes ChinaCo. Please see the Definitions page in the appendix for detailed definitions.
Excludes We Memberships.
1.
2.
Includes -1% of occupancy from All Access memberships, representing -7.3k total memberships in 2020.
90%
81%
17%
2022E Q4
93%
84%
23%
2023E
95%
85%
29%
2024E
27 | wework
Ⓒ2021 WeWork. Confidential.View entire presentation