Cyxtera Investor Presentation Deck
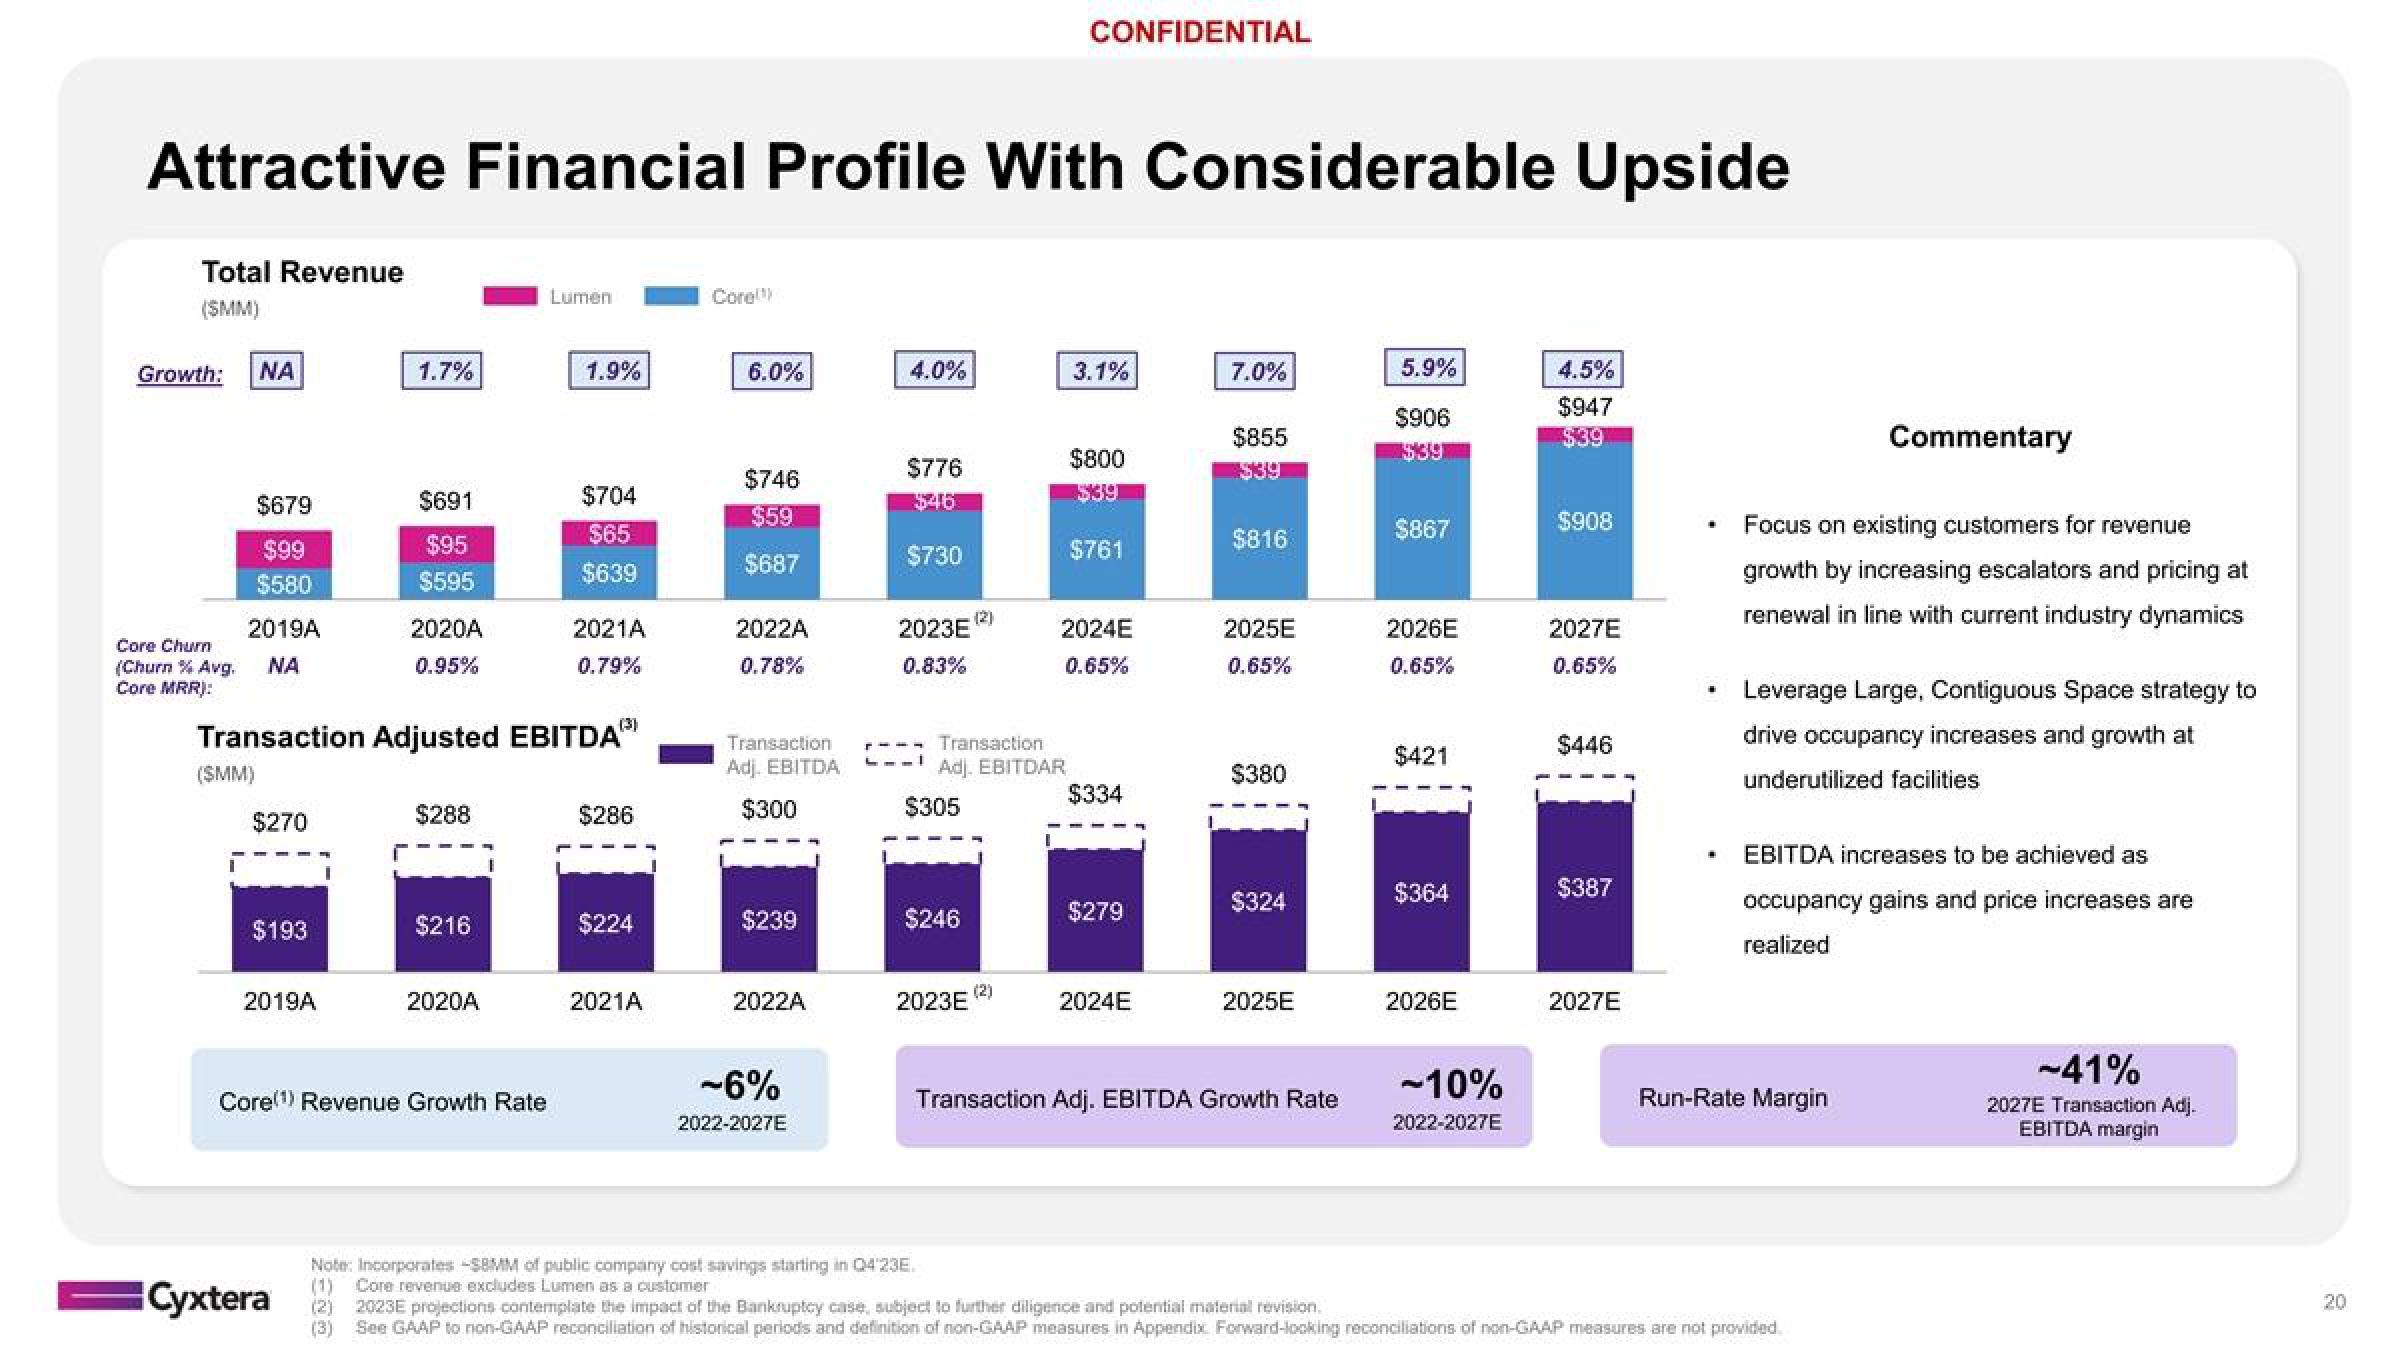
Attractive Financial Profile With Considerable Upside
Total Revenue
(SMM)
Growth: ΝΑ
$679
$99
$580
2019A
Core Churn
(Churn % Avg. ΝΑ
Core MRR):
(SMM)
$270
$193
2019A
1.7%
$691
$95
$595
Cyxtera
2020A
0.95%
Transaction Adjusted EBITDAⓇ)
$288
$216
2020A
Core(¹) Revenue Growth Rate
Lumen
1.9%
$704
$65
$639
2021A
0.79%
(3)
$286
$224
2021A
Core!
6.0%
$746
$59
$687
2022A
0.78%
Transaction
Adj. EBITDA
$300
$239
2022A
-6%
2022-2027E
4.0%
$776
$46
$730
2023E
0.83%
L__I
Transaction
Adj. EBITDAR
$305
$246
CONFIDENTIAL
2023E
3.1%
$800
$39
$761
2024E
0.65%
$334
$279
2024E
7.0%
$855
$816
2025E
0.65%
$380
$324
2025E
Transaction Adj. EBITDA Growth Rate
5.9%
$906
$39
$867
2026E
0.65%
$421
$364
2026E
-10%
2022-2027E
4.5%
$947
$908
2027E
0.65%
$446
$387
2027E
Focus on existing customers for revenue
growth by increasing escalators and pricing at
renewal in line with current industry dynamics
Commentary
Leverage Large, Contiguous Space strategy to
drive occupancy increases and growth at
underutilized facilities
EBITDA increases to be achieved as
occupancy gains and price increases are
realized
Run-Rate Margin
Note: Incorporates -S8MM of public company cost savings starting in Q4'23E.
(1) Core revenue excludes Lumen as a customer
2023E projections contemplate the impact of the Bankruptcy case, subject to further diligence and potential material revision.
See GAAP to non-GAAP reconciliation of historical periods and definition of non-GAAP measures in Appendix Forward-looking reconciliations of non-GAAP measures are not provided
-41%
2027E Transaction Adj.
EBITDA margin
20View entire presentation