Granite Ridge Investor Presentation Deck
Overview
Assets
Strategy & Execution
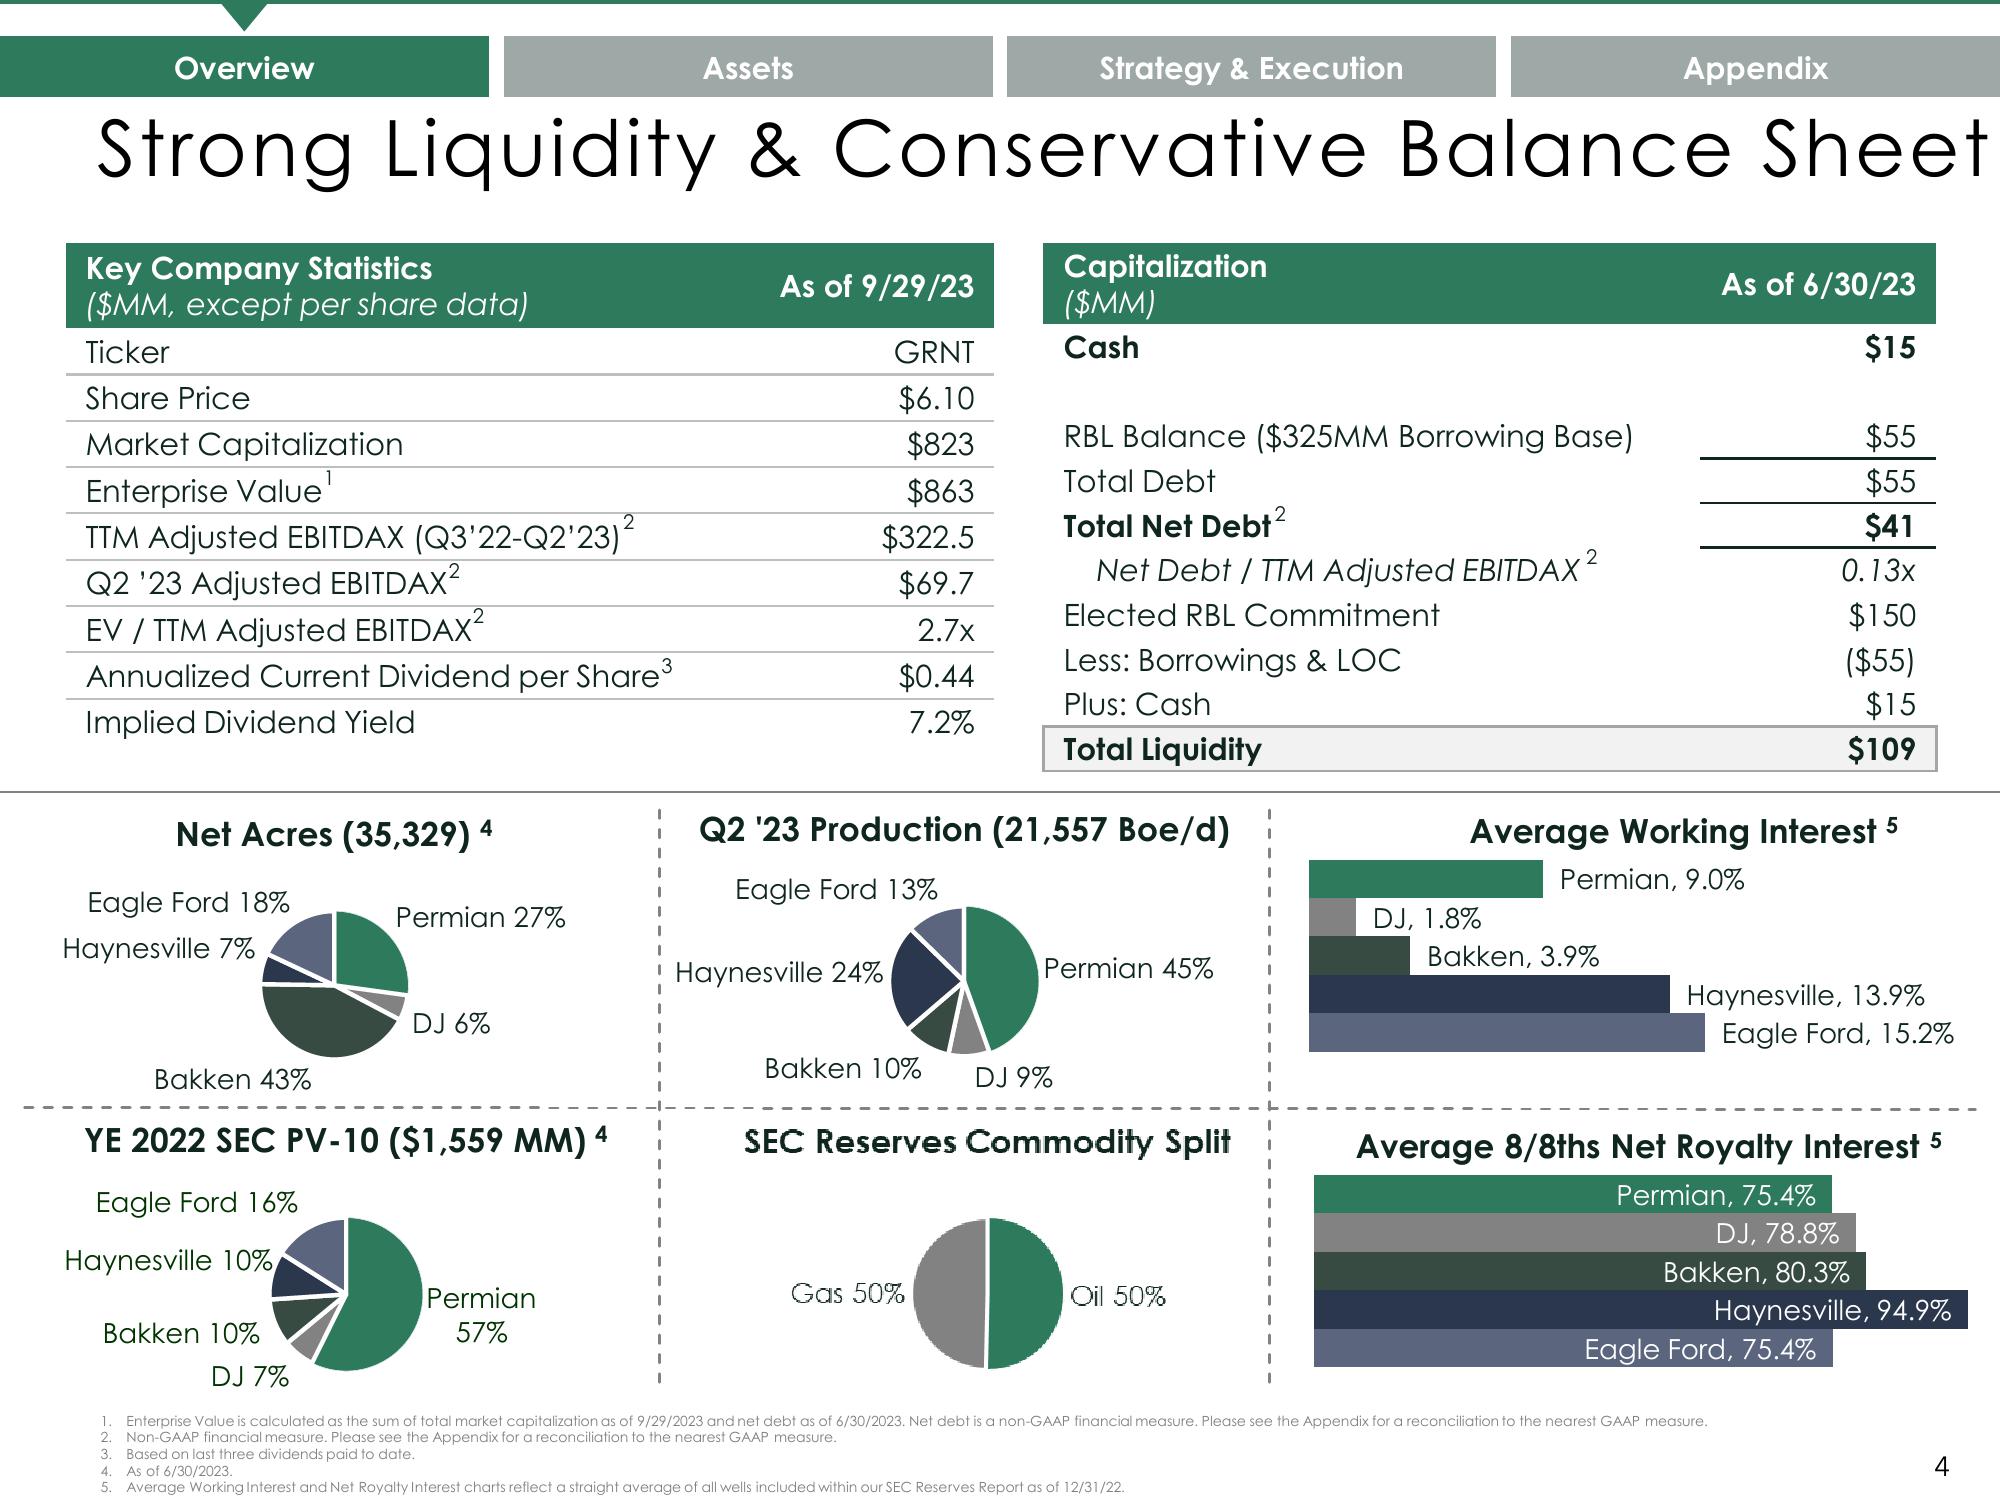
Strong Liquidity & Conservative Balance Sheet
Key Company Statistics
($MM, except per share data)
Ticker
Share Price
Market Capitalization
Enterprise Value¹
TTM Adjusted EBITDAX (Q3'22-Q2'23)²
Q2 '23 Adjusted EBITDAX²
EV / TTM Adjusted EBITDAX²
Annualized Current Dividend per Share³
Implied Dividend Yield
Net Acres (35,329) 4
Eagle Ford 18%
Haynesville 7%
Bakken 43%
Haynesville 10%
YE 2022 SEC PV-10 ($1,559 MM) 4
Eagle Ford 16%
Bakken 10%
SAWN-
Permian 27%
DJ 7%
DJ 6%
Permian
57%
3. Based on last three dividends paid to date.
As of 9/29/23
GRNT
$6.10
$823
$863
$322.5
$69.7
2.7x
$0.44
7.2%
Haynesville 24%
Bakken 10%
Q2 '23 Production (21,557 Boe/d)
Eagle Ford 13%
Gas 50%
Capitalization
($MM)
Cash
DJ 9%
RBL Balance ($325MM Borrowing Base)
Total Debt
Total Net Debt²
●
Net Debt / TTM Adjusted EBITDAX²
Elected RBL Commitment
Less: Borrowings & LOC
Plus: Cash
Total Liquidity
Permian 45%
SEC Reserves Commodity Split
Oil 50%
2
4. As of 6/30/2023.
5. Average Working Interest and Net Royalty Interest charts reflect a straight average of all wells included within our SEC Reserves Report as of 12/31/22.
DJ, 1.8%
Appendix
Bakken, 3.9%
As of 6/30/23
$15
Average Working Interest 5
Permian, 9.0%
1. Enterprise Value is calculated as the sum of total market capitalization as of 9/29/2023 and net debt as of 6/30/2023. Net debt is a non-GAAP financial measure. Please see the Appendix for a reconciliation to the nearest GAAP measure.
2. Non-GAAP financial measure. Please see the Appendix for a reconciliation to the nearest GAAP measure.
$55
$55
$41
0.13x
$150
($55)
$15
$109
Haynesville, 13.9%
Eagle Ford, 15.2%
Average 8/8ths Net Royalty Interest 5
Permian, 75.4%
Eagle Ford, 75.4%
DJ, 78.8%
Bakken, 80.3%
Haynesville, 94.9%
4View entire presentation