Summit Hotel Properties Investor Presentation Deck
26
Balance Sheet Well-Positioned for Current Environment
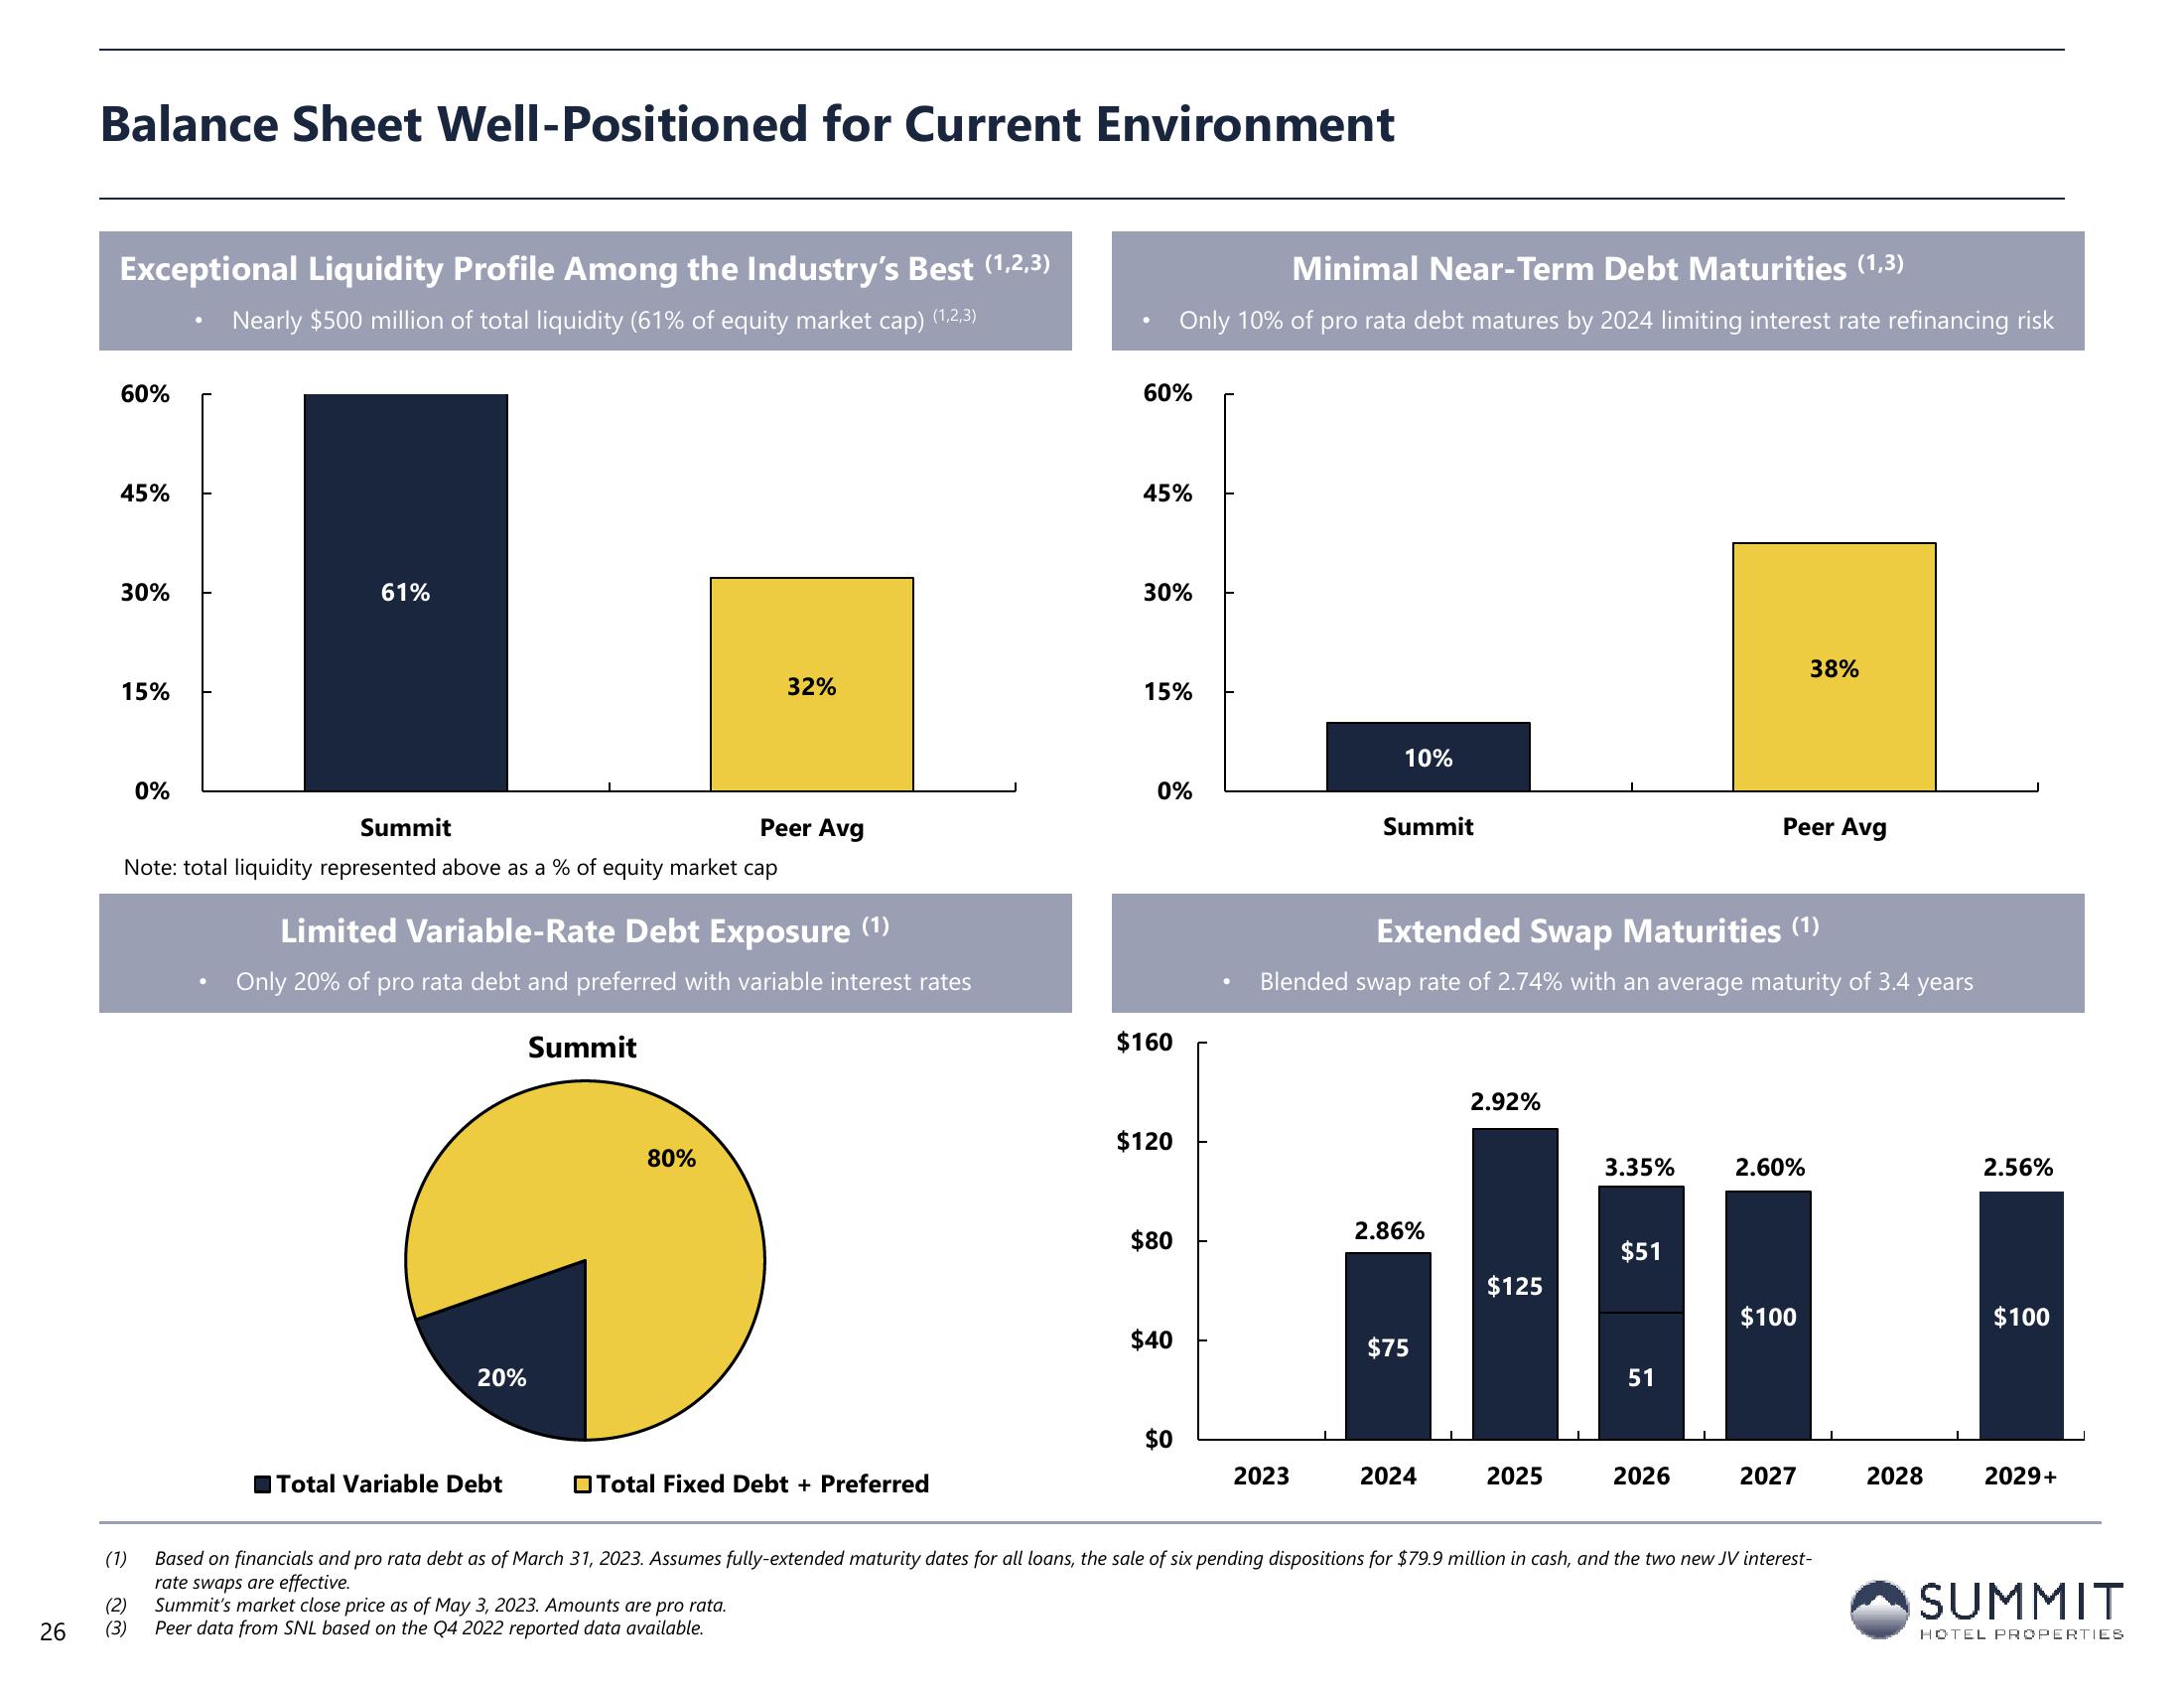
Exceptional Liquidity Profile Among the Industry's Best (1,2,3)
Nearly $500 million of total liquidity (61% of equity market cap) (1,2,3)
60%
45%
30%
15%
0%
(1)
(2)
(3)
61%
Summit
Note: total liquidity represented above as a % of equity market cap
20%
Limited Variable-Rate Debt Exposure (1)
Only 20% of pro rata debt and preferred with variable interest rates
Total Variable Debt
Summit
32%
Peer Avg
80%
Total Fixed Debt + Preferred
60%
45%
30%
15%
Minimal Near-Term Debt Maturities (1,3)
Only 10% of pro rata debt matures by 2024 limiting interest rate refinancing risk
0%
$160
$120
$80
$40
$0
10%
2023
Summit
Extended Swap Maturities (¹)
Blended swap rate of 2.74% with an average maturity of 3.4 years
2.86%
$75
2024
2.92%
$125
2025
3.35%
$51
51
2026
Peer Avg
2.60%
38%
$100
2027
Based on financials and pro rata debt as of March 31, 2023. Assumes fully-extended maturity dates for all loans, the sale of six pending dispositions for $79.9 million in cash, and the two new JV interest-
rate swaps are effective.
Summit's market close price as of May 3, 2023. Amounts are pro rata.
Peer data from SNL based on the Q4 2022 reported data available.
2028
2.56%
-
$100
2029+
SUMMIT
HOTEL PROPERTIESView entire presentation