Palantir IPO Presentation Deck
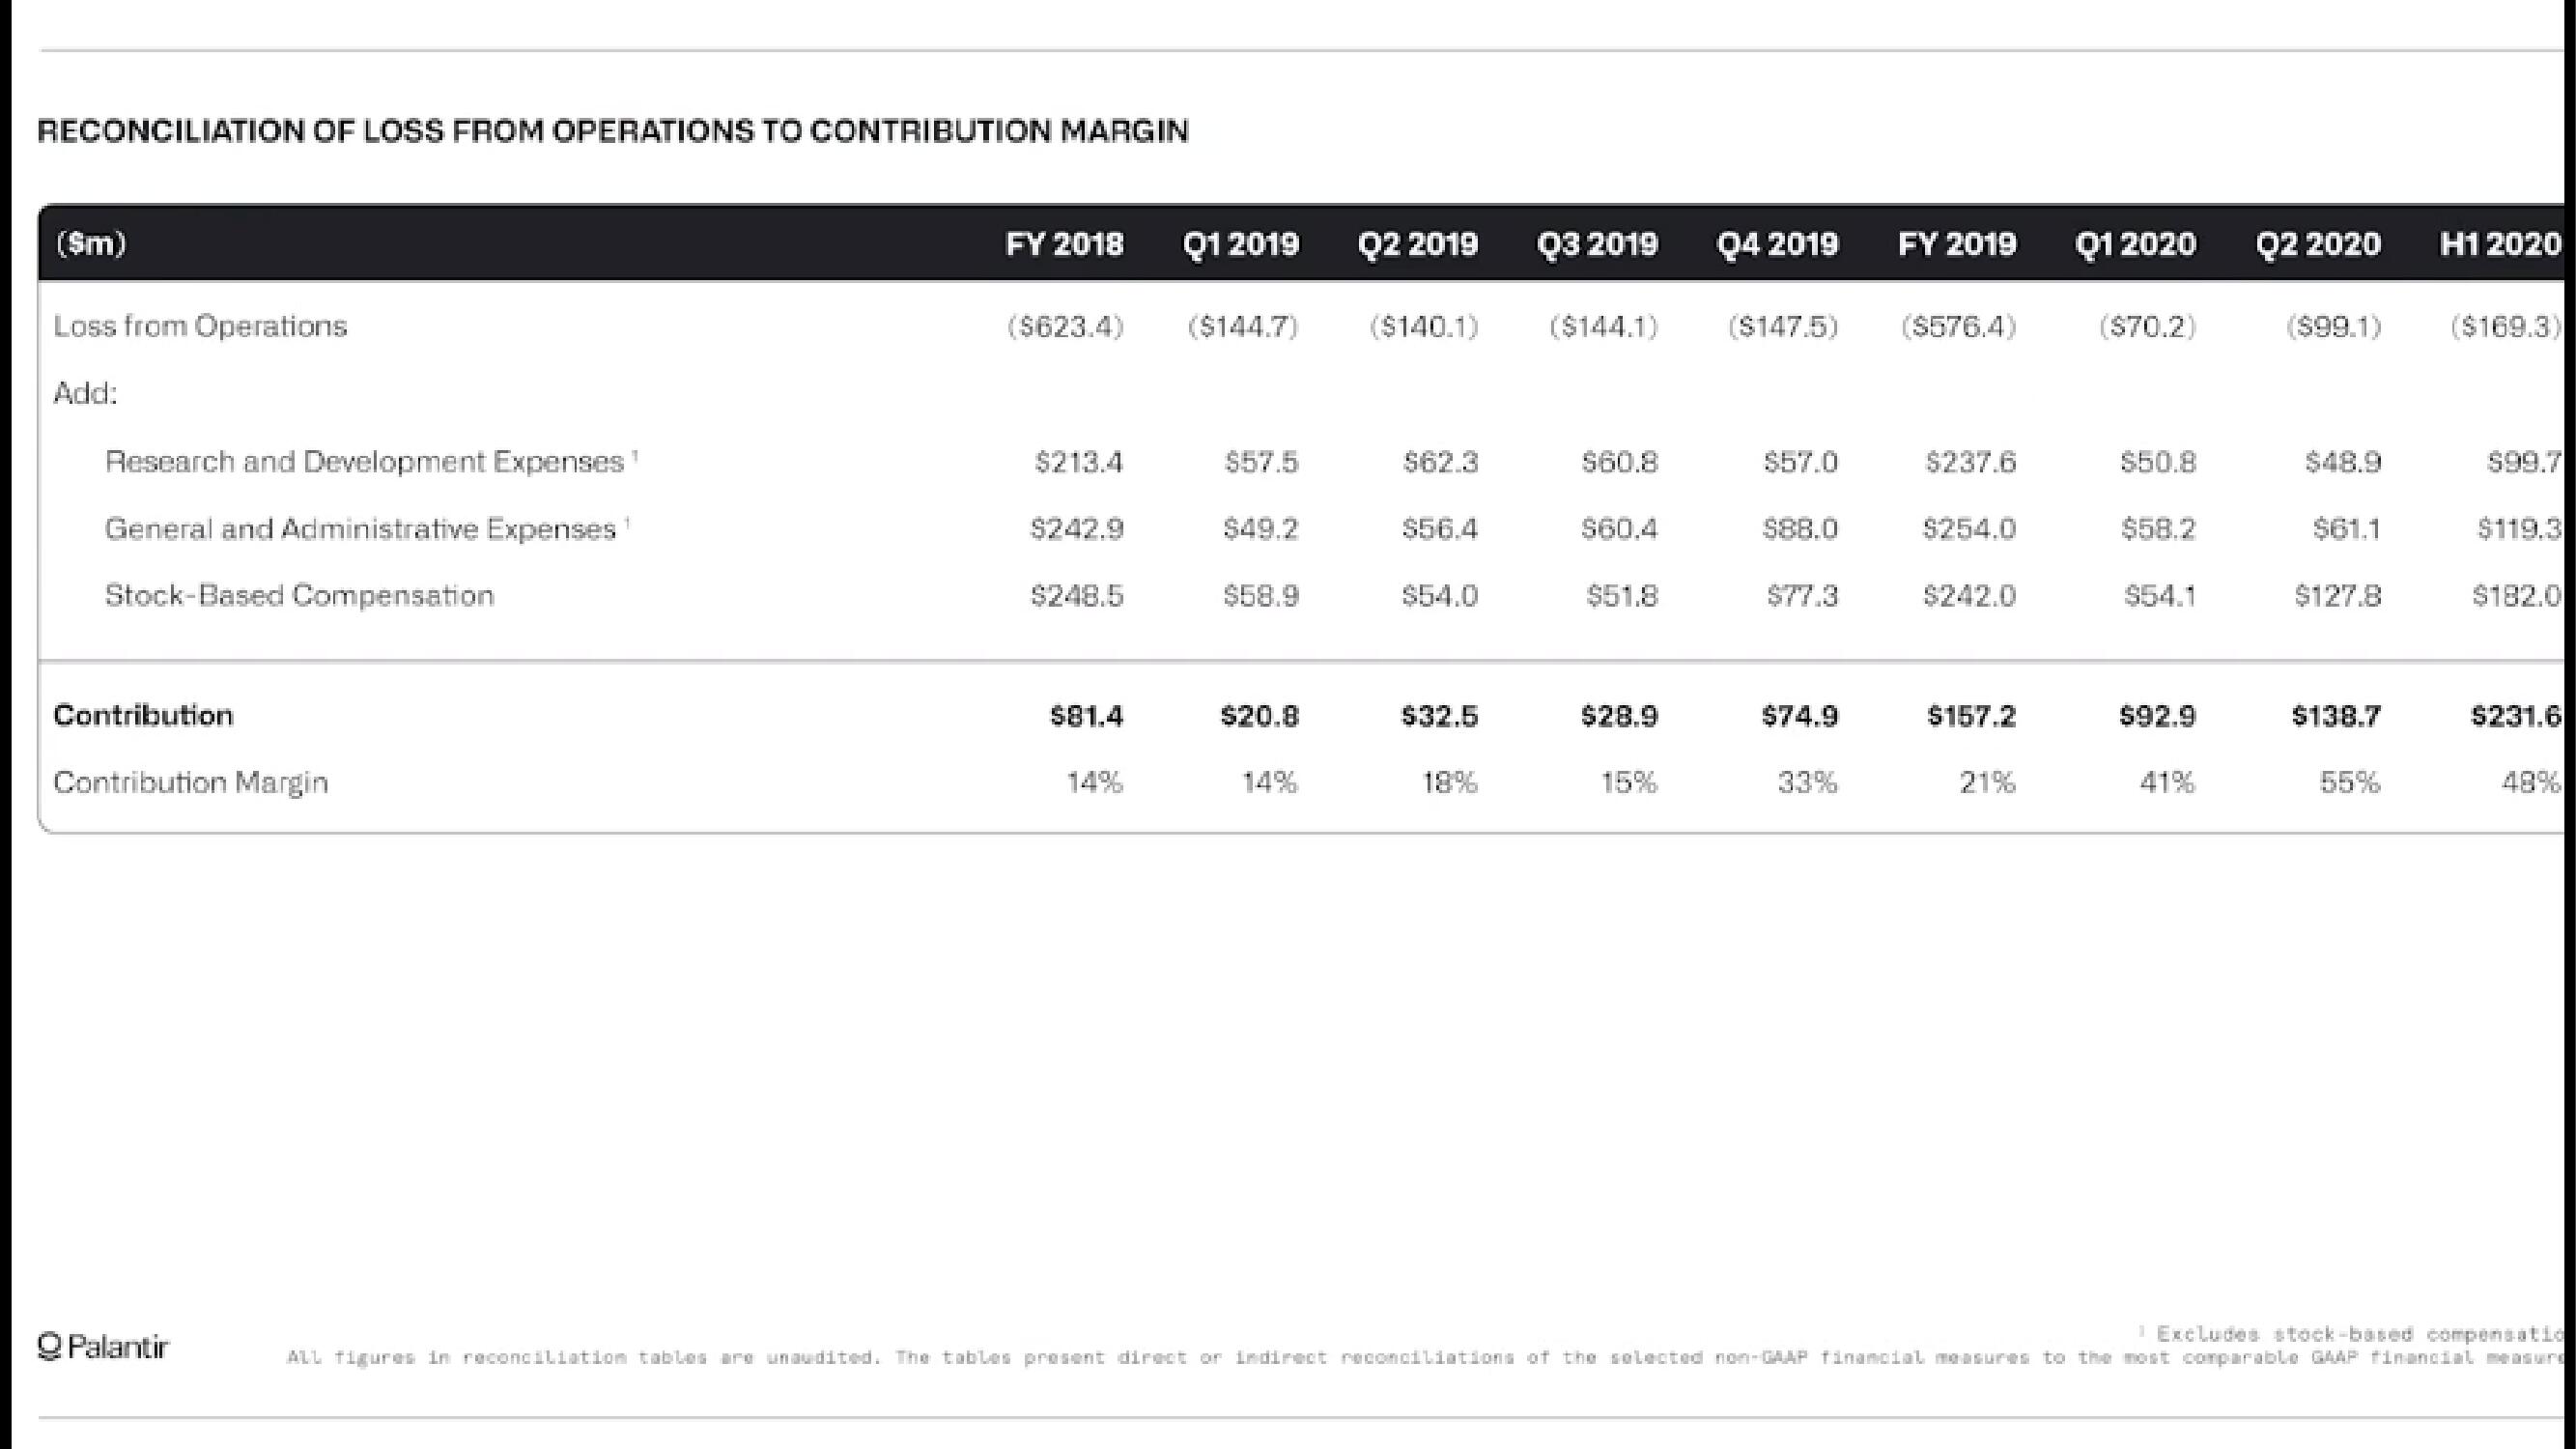
RECONCILIATION OF LOSS FROM OPERATIONS TO CONTRIBUTION MARGIN
($m)
Loss from Operations
Add:
1
Research and Development Expenses ¹
General and Administrative Expenses
Stock-Based Compensation
Contribution
Contribution Margin
Q Palantir
FY 2018
($623.4)
$213.4
$242.9
$248.5
$81.4
Q1 2019
($144.7)
$57.5
$58.9
$20.8
Q2 2019
($140.1)
$62.3
$56.4
$54.0
$32.5
18%
Q3 2019
($144.1)
$60.8
$60.4
$51.8
$28.9
15%
Q4 2019
($147.5)
$57.0
$88.0
$74.9
33%
FY 2019
($576.4)
$237.6
$254.0
$242.0
$157.2
21%
Q1 2020
($70.2)
$50.8
$58.2
$54.1
$92.9
41%
Q2 2020
($99.1)
$61.1
$127.8
$138.7
55%
Hidd
($169.3)
$99.7
$119.3
$182.0
$231.6
48%
1 Excludes stock-based compensatio
ALL figures in reconciliation tables are unaudited. The tables present direct or indirect reconciliations of the selected non-GAAP Tinancial measures to the most comparable GAAP financial measureView entire presentation