Spring 2023 Solar Industry Update
U.S. Installation Breakdown
Annual: EIA (GWac)
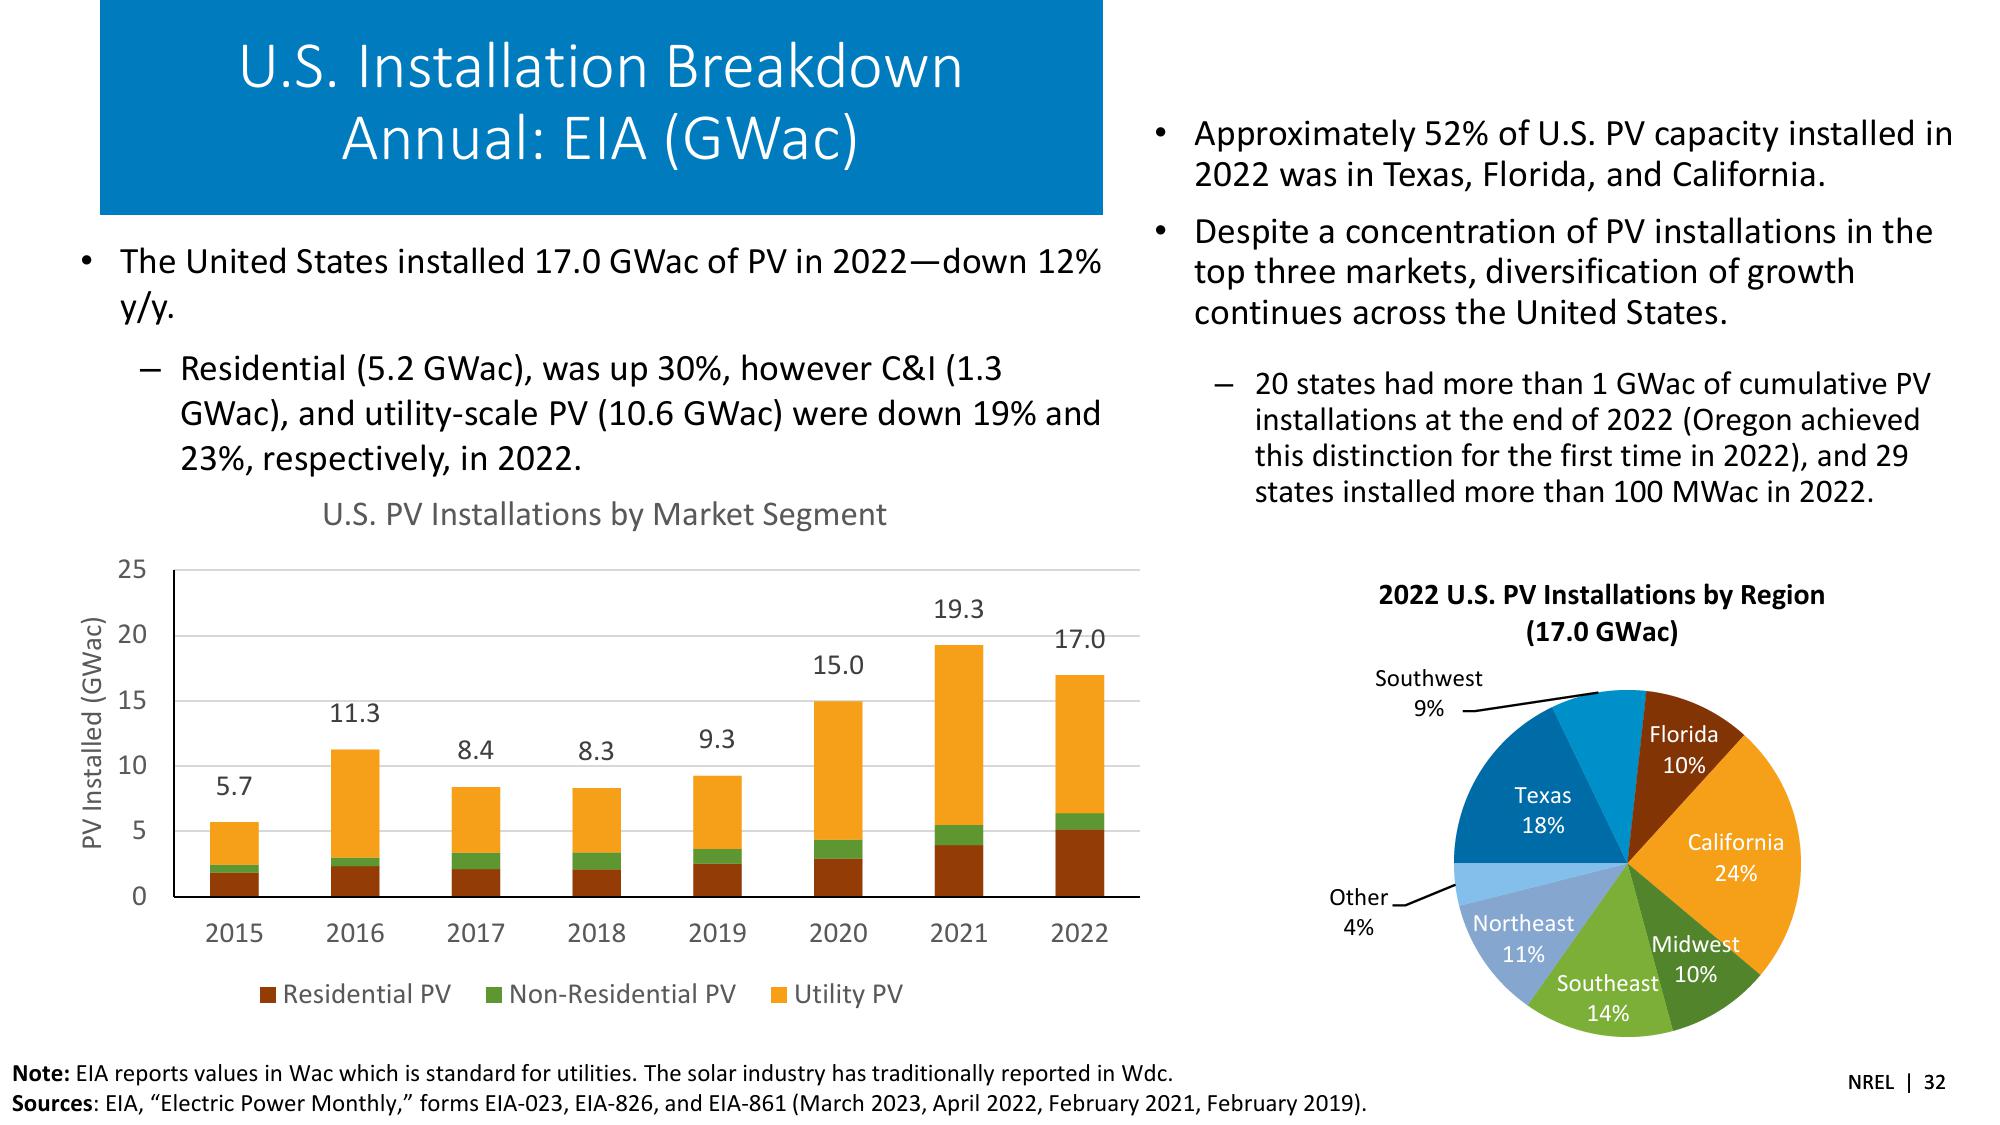
• The United States installed 17.0 GWac of PV in 2022-down 12%
y/y.
Residential (5.2 GWac), was up 30%, however C&I (1.3
GWac), and utility-scale PV (10.6 GWac) were down 19% and
23%, respectively, in 2022.
U.S. PV Installations by Market Segment
.
Approximately 52% of U.S. PV capacity installed in
2022 was in Texas, Florida, and California.
Despite a concentration of PV installations in the
top three markets, diversification of growth
continues across the United States.
-
20 states had more than 1 GWac of cumulative PV
installations at the end of 2022 (Oregon achieved
this distinction for the first time in 2022), and 29
states installed more than 100 MWac in 2022.
PV Installed (GWac)
5
10
15
45
25
20
20
0
5.7
11.3
9.3
8.4
8.3
19.3
17.0
15.0
2022 U.S. PV Installations by Region
(17.0 GWac)
Southwest
9%
Texas
18%
Florida
10%
California
24%
Other
2015
2016
2017
2018
2019
2020
2021
2022
4%
Northeast
11%
Midwest
■Residential PV
■Non-Residential PV
Utility PV
Southeast 10%
14%
Note: EIA reports values in Wac which is standard for utilities. The solar industry has traditionally reported in Wdc.
Sources: EIA, "Electric Power Monthly," forms EIA-023, EIA-826, and EIA-861 (March 2023, April 2022, February 2021, February 2019).
NREL 32View entire presentation