Melrose Results Presentation Deck
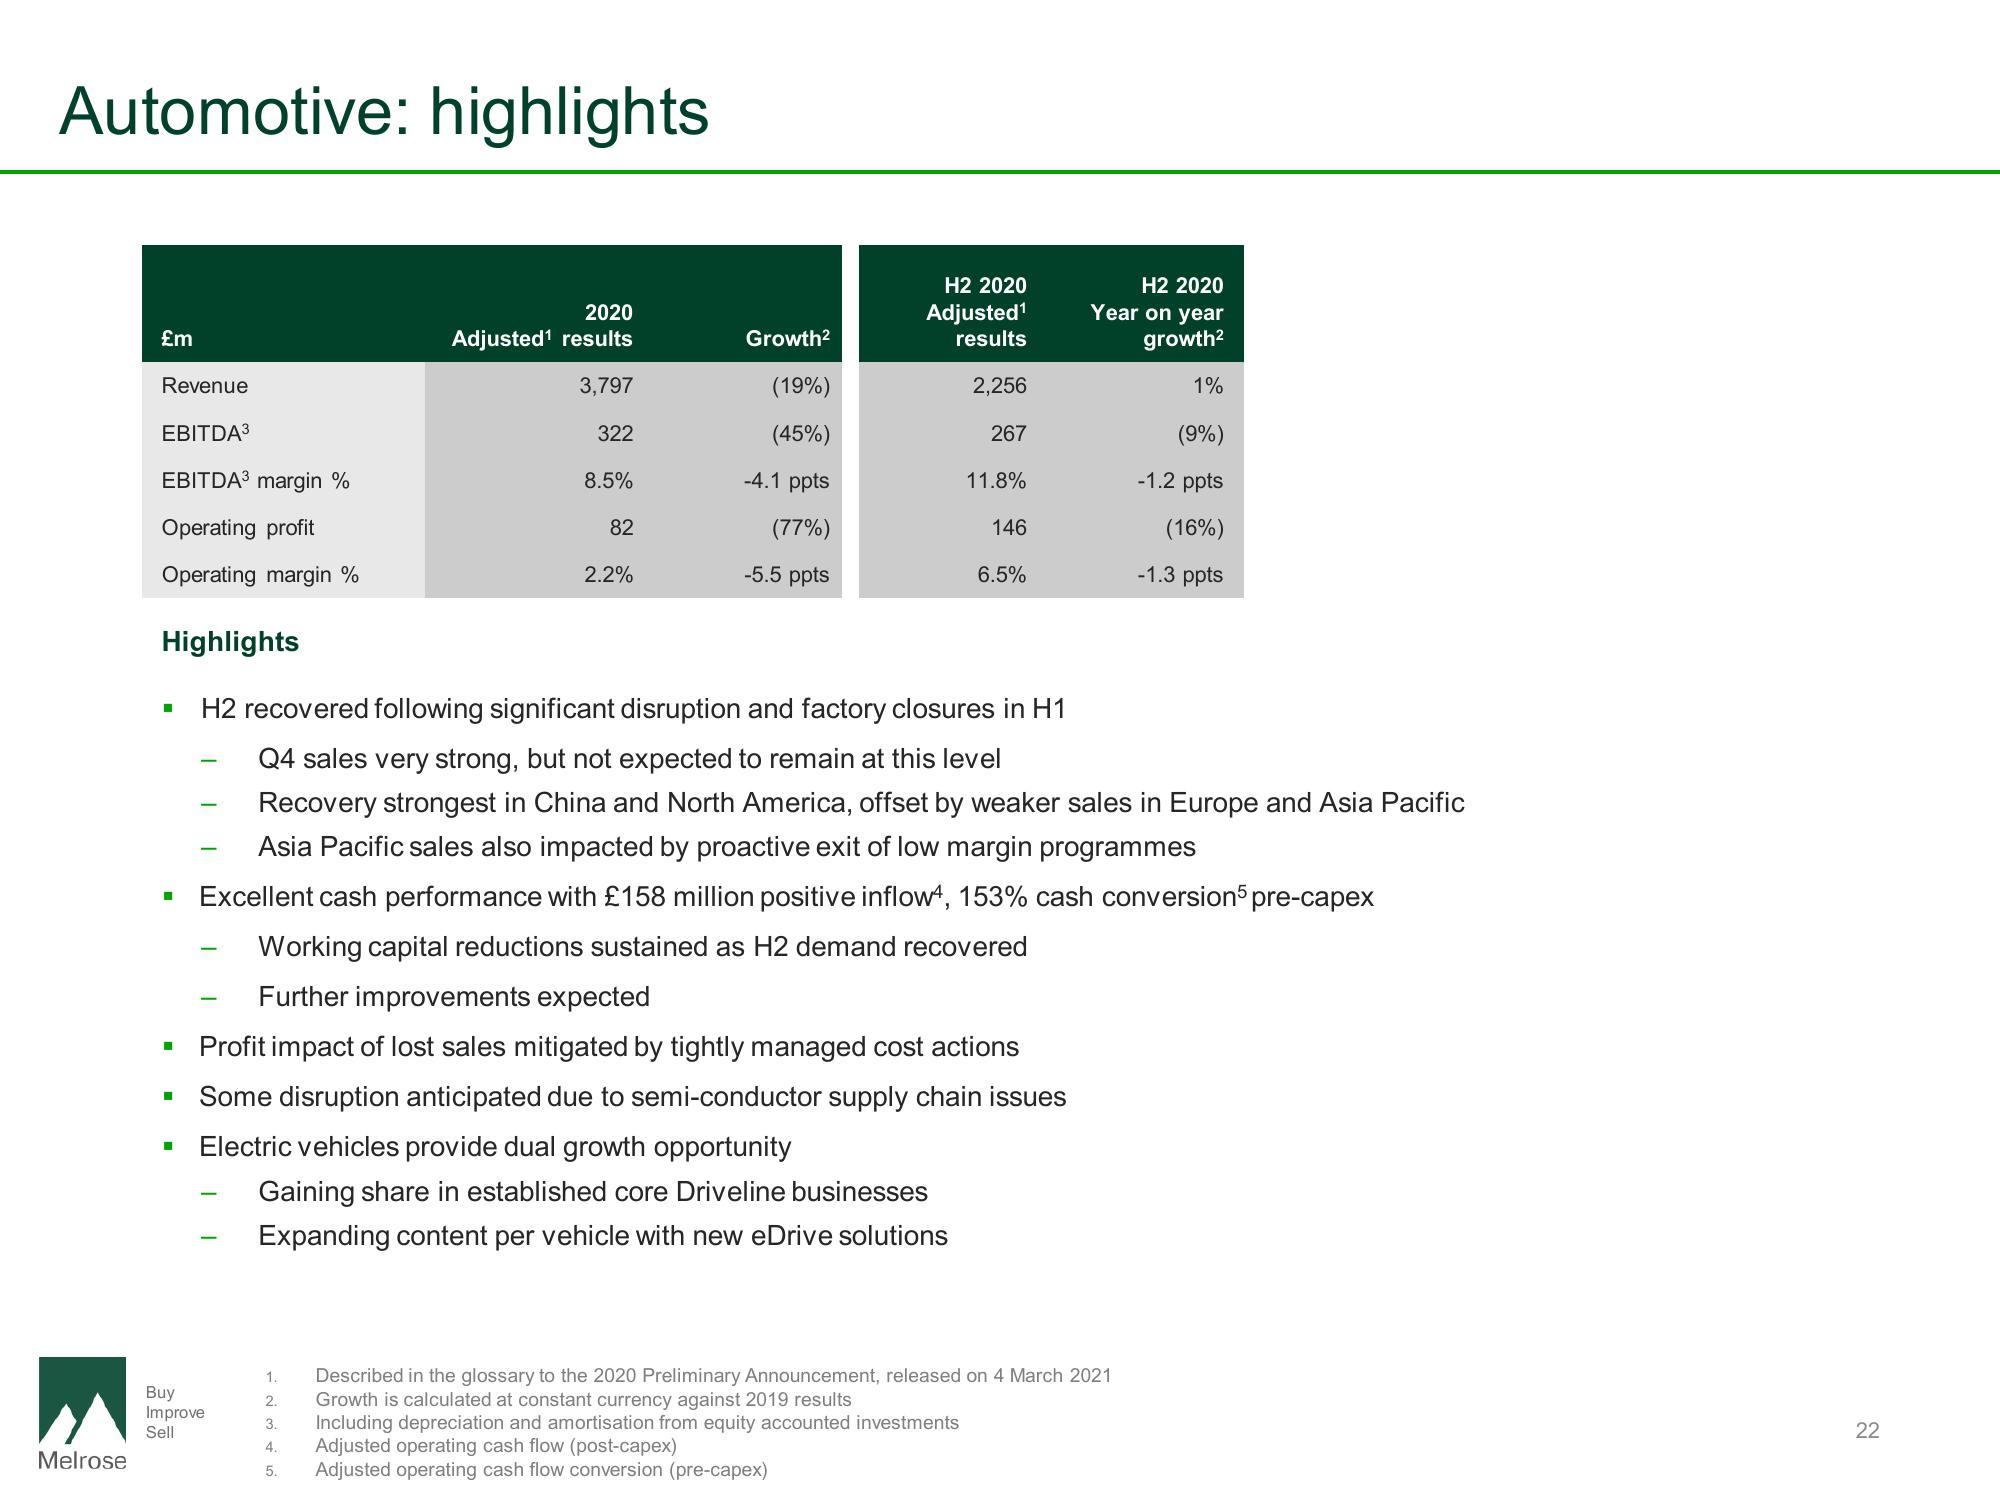
Automotive: highlights
Melrose
£m
Revenue
EBITDA³
EBITDA³ margin %
Operating profit
Operating margin %
■
■
■
■
-
Buy
Improve
Sell
2020
Adjusted¹ results
3,797
322
8.5%
1.
2.
3.
4.
5.
82
2.2%
Highlights
H2 recovered following significant disruption and factory closures in H1
Q4 sales very strong, but not expected to remain at this level
Recovery strongest in China and North America, offset by weaker sales in Europe and Asia Pacific
Asia Pacific sales also impacted by proactive exit of low margin programmes
Excellent cash performance with £158 million positive inflow4, 153% cash conversion5 pre-capex
Working capital reductions sustained as H2 demand recovered
Further improvements expected
▪ Profit impact of lost sales mitigated by tightly managed cost actions
Some disruption anticipated due to semi-conductor supply chain issues
Electric vehicles provide dual growth opportunity
Gaining share in established core Driveline businesses
Expanding content per vehicle with new eDrive solutions
Growth²
(19%)
(45%)
-4.1 ppts
(77%)
-5.5 ppts
H2 2020
Adjusted¹
results
2,256
267
11.8%
146
6.5%
H2 2020
Year on year
growth²
1%
(9%)
-1.2 ppts
(16%)
-1.3 ppts
Described in the glossary to the 2020 Preliminary Announcement, released on 4 March 2021
Growth is calculated at constant currency against 2019 results
Including depreciation and amortisation from equity accounted investments
Adjusted operating cash flow (post-capex)
Adjusted operating cash flow conversion (pre-capex)
22View entire presentation