OppFi Results Presentation Deck
F
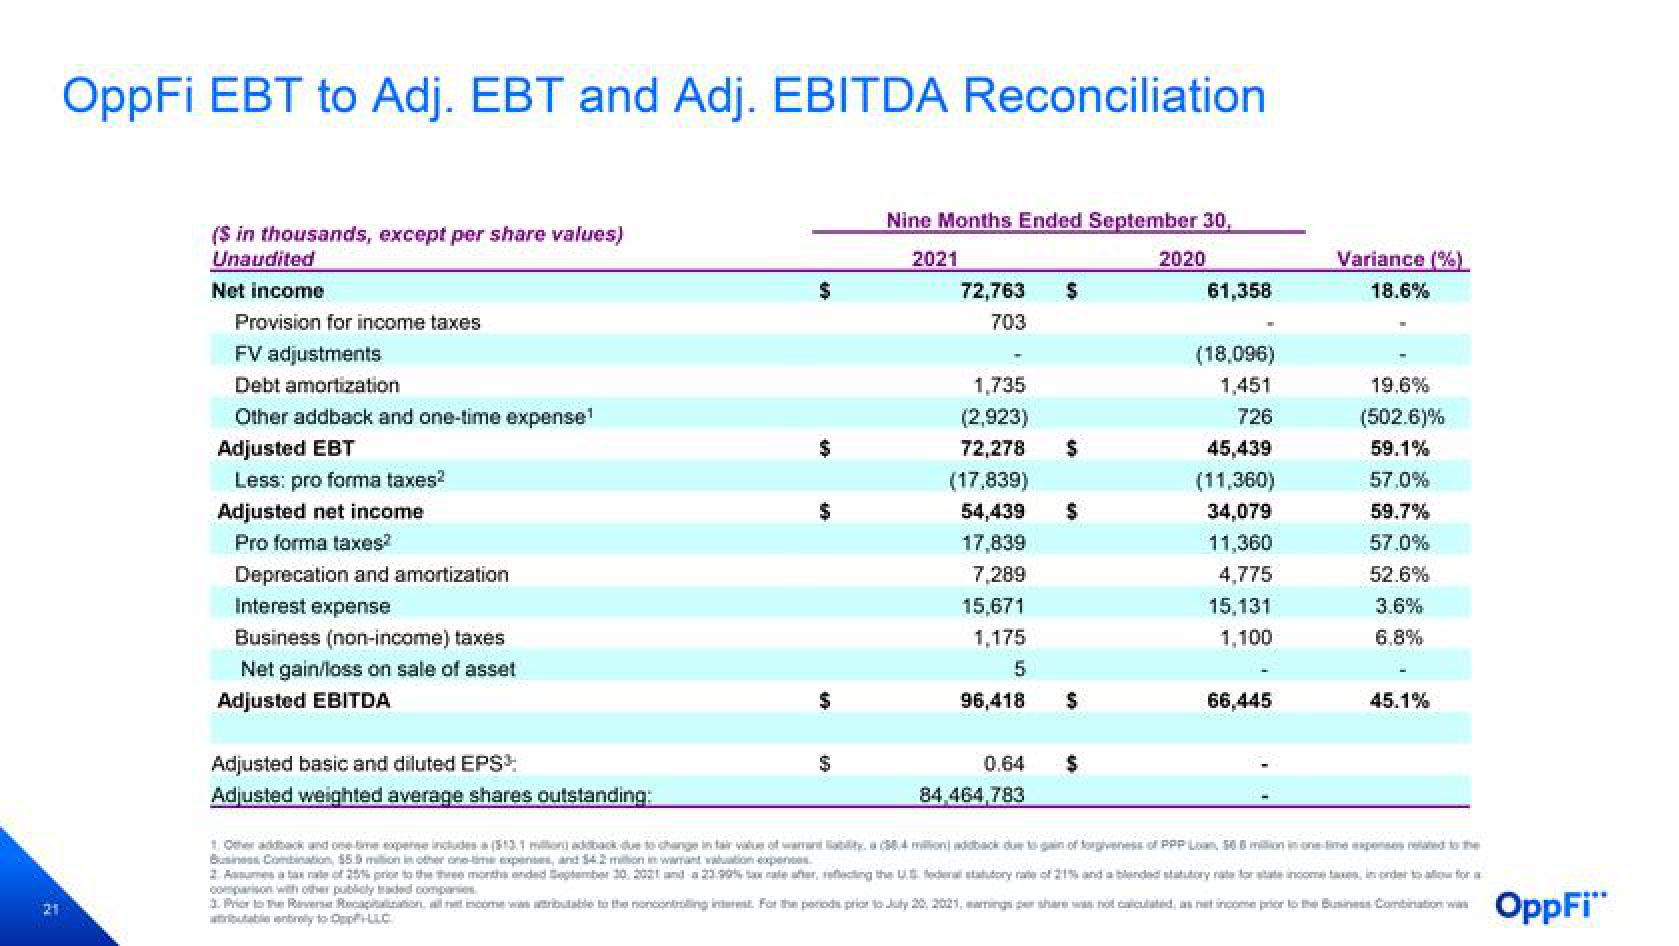
OppFi EBT to Adj. EBT and Adj. EBITDA Reconciliation
($ in thousands, except per share values)
Unaudited
Net income
Provision for income taxes
FV adjustments
Debt amortization
Other addback and one-time expense¹
Adjusted EBT
Less: pro forma taxes²
Adjusted net income
Pro forma taxes?
Deprecation and amortization
Interest expense
Business (non-income) taxes
Net gain/loss on sale of asset
Adjusted EBITDA
Adjusted basic and diluted EPS³:
Adjusted weighted average shares outstanding:
$
Nine Months Ended September 30,
2021
72,763 $
703
1,735
(2,923)
72,278
(17,839)
$
54,439 $
17,839
7,289
15,671
1,175
5
96,418
0.64
84,464,783
$
2020
61,358
(18,096)
1,451
726
45,439
(11,360)
34,079
11,360
4,775
15,131
1,100
66,445
Variance (%)
18.6%
19.6%
(502.6)%
59.1%
57.0%
59.7%
57.0%
52.6%
3.6%
6,8%
45.1%
1. Other addback and one time expense includes a (313,1 million addback due to change in fair value of wamant liability, a (884 million) addback due to gain of forgiveness of PPP Loan, 508 million in one-time expenses related to the
Business Combination, $59 million in other one-time expenses, and 54.2 million in warant valuation expenses
2 Astax rate of 25% prior to the three
a 23.99% tax rate aer, reflecting the U.S. federal stah
for a
3. Prior to the Reverse Recapitaination, all net income was attributable to the noncontrolling interest. For the poods prior to July 20, 2021, marings per share was not calculated as net income prior to the Business Combination was
atributable try to Opp/LLC
OppFi™View entire presentation