Apollo Global Management Investor Day Presentation Deck
Asset Backed-Finance Historical Loss Performance
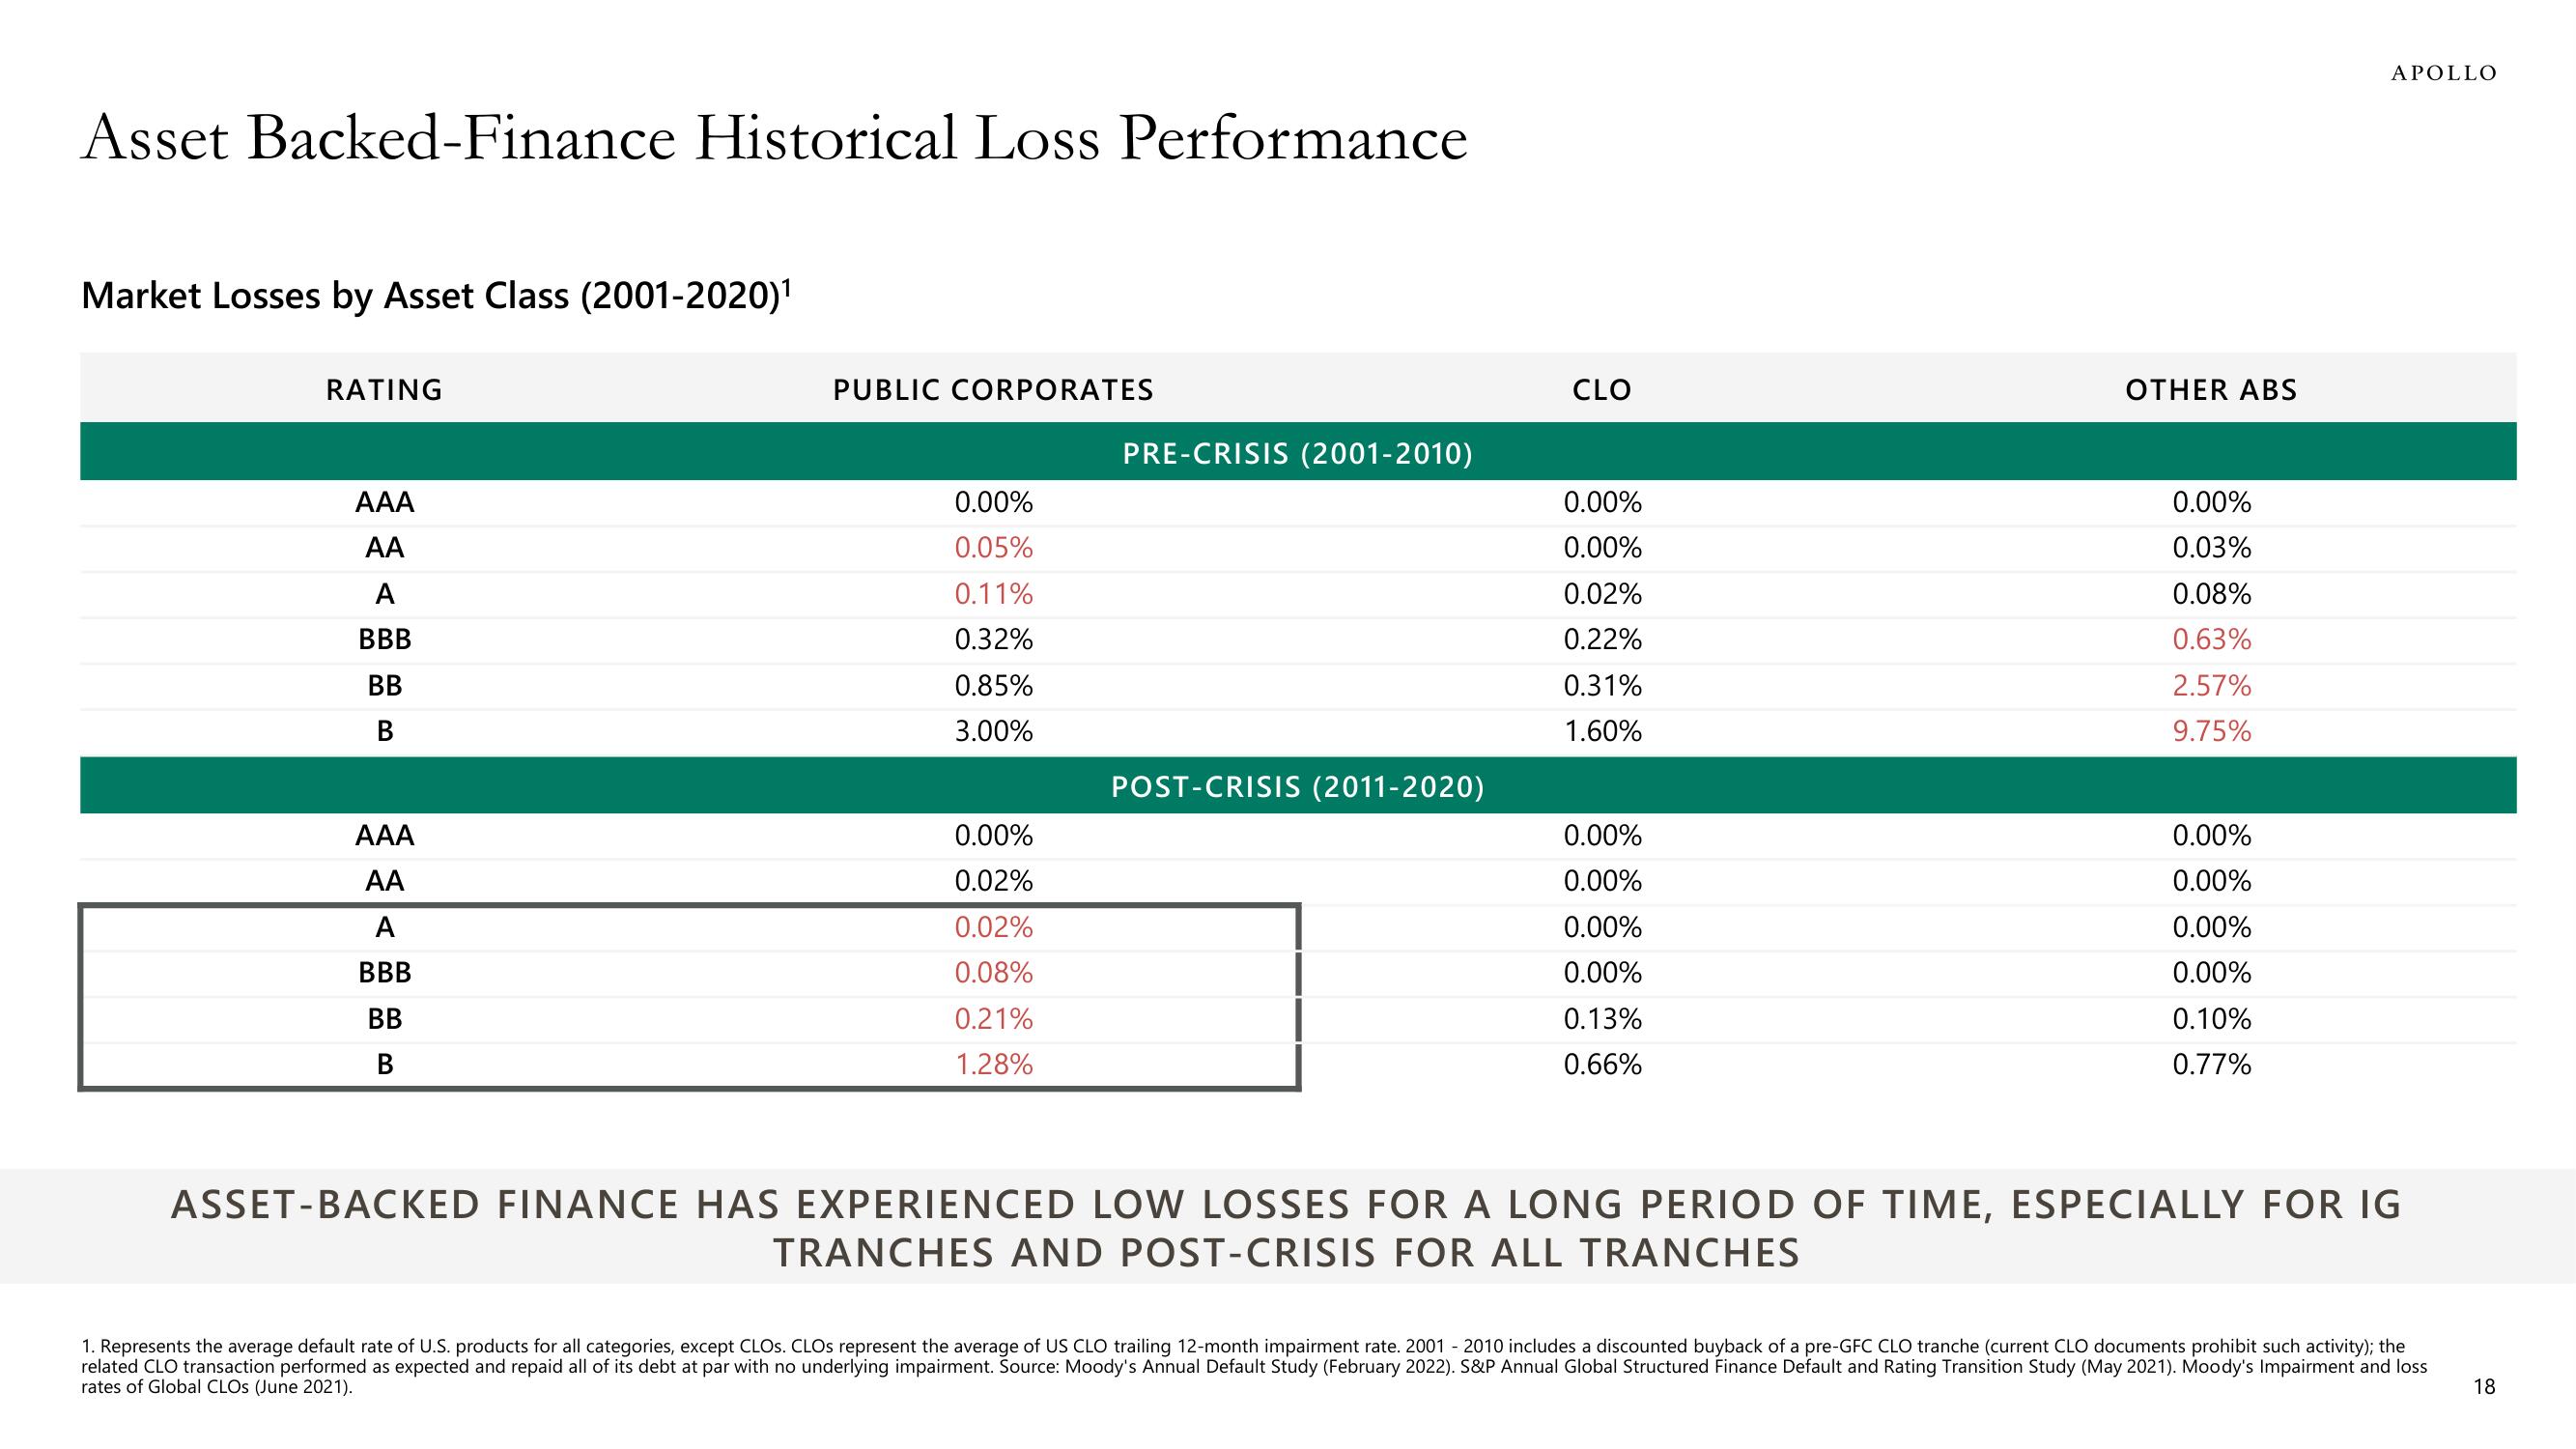
Market Losses by Asset Class (2001-2020)¹
RATING
AAA
AA
A
BBB
BB
AAA
AA
A
BBB
BB
B
PUBLIC CORPORATES
0.00%
0.05%
0.11%
0.32%
0.85%
3.00%
0.00%
0.02%
0.02%
0.08%
0.21%
1.28%
PRE-CRISIS (2001-2010)
POST-CRISIS (2011-2020)
CLO
0.00%
0.00%
0.02%
0.22%
0.31%
1.60%
0.00%
0.00%
0.00%
0.00%
0.13%
0.66%
OTHER ABS
0.00%
0.03%
0.08%
0.63%
2.57%
9.75%
0.00%
0.00%
0.00%
0.00%
0.10%
0.77%
APOLLO
ASSET-BACKED FINANCE HAS EXPERIENCED LOW LOSSES FOR A LONG PERIOD OF TIME, ESPECIALLY FOR IG
TRANCHES AND POST-CRISIS FOR ALL TRANCHES
1. Represents the average default rate of U.S. products for all categories, except CLOS. CLOS represent the average of US CLO trailing 12-month impairment rate. 2001 - 2010 includes a discounted buyback of a pre-GFC CLO tranche (current CLO documents prohibit such activity); the
related CLO transaction performed as expected and repaid all of its debt at par with no underlying impairment. Source: Moody's Annual Default Study (February 2022). S&P Annual Global Structured Finance Default and Rating Transition Study (May 2021). Moody's Impairment and loss
rates of Global CLOS (June 2021).
18View entire presentation