Snap Inc Results Presentation Deck
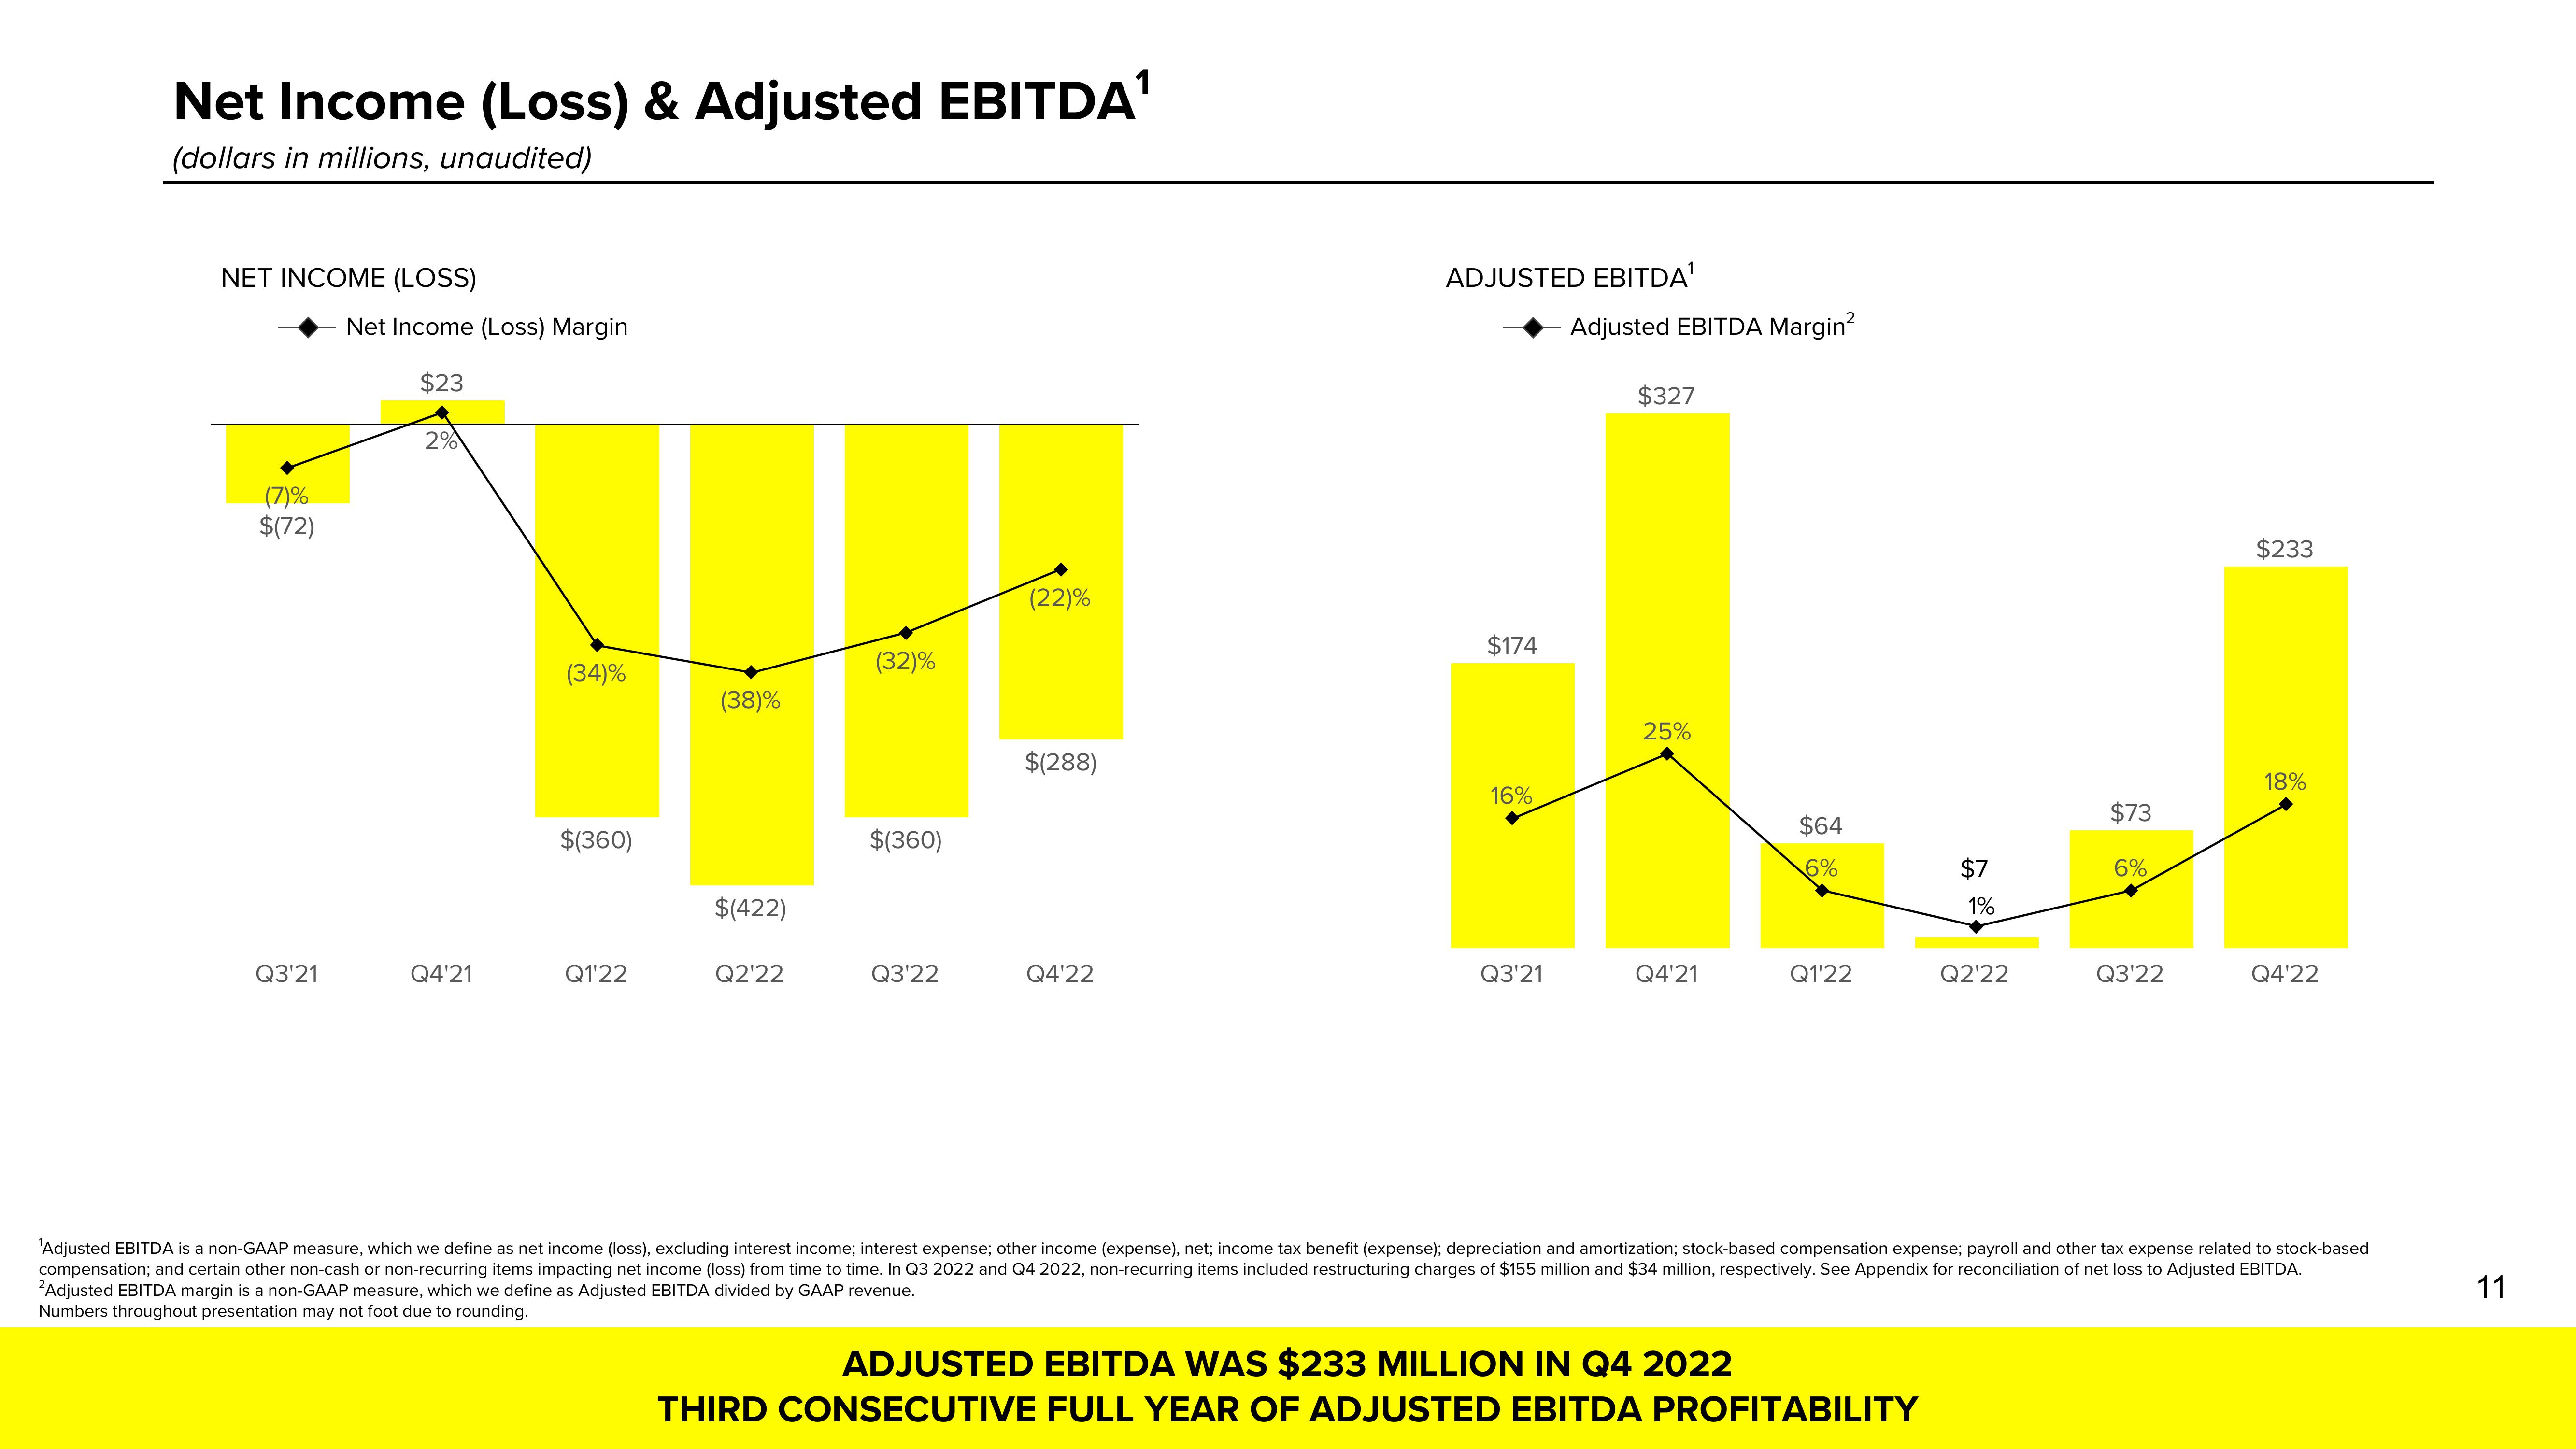
Net Income (Loss) & Adjusted EBITDA¹
(dollars in millions, unaudited)
NET INCOME (LOSS)
(7)%
$(72)
Q3'21
Net Income (Loss) Margin
$23
2%
Q4'21
(34)%
$(360)
Q1'22
(38)%
$(422)
Q2'22
(32)%
$(360)
Q3'22
(22)%
$(288)
Q4'22
ADJUSTED EBITDA¹
$174
16%
Q3'21
Adjusted EBITDA Margin²
$327
25%
Q4'21
$64
6%
Q1'22
$7
1%
ADJUSTED EBITDA WAS $233 MILLION IN Q4 2022
THIRD CONSECUTIVE FULL YEAR OF ADJUSTED EBITDA PROFITABILITY
Q2'22
$73
6%
Q3'22
$233
18%
Q4'22
'Adjusted EBITDA is a non-GAAP measure, which we define as net income (loss), excluding interest income; interest expense; other income (expense), net; income tax benefit (expense); depreciation and amortization; stock-based compensation expense; payroll and other tax expense related to stock-based
compensation; and certain other non-cash or non-recurring items impacting net income (loss) from time to time. In Q3 2022 and Q4 2022, non-recurring items included restructuring charges of $155 million and $34 million, respectively. See Appendix for reconciliation of net loss to Adjusted EBITDA.
²Adjusted EBITDA margin is a non-GAAP measure, which we define as Adjusted EBITDA divided by GAAP revenue.
Numbers throughout presentation may not foot due to rounding.
11View entire presentation