2nd Quarter 2021 Investor Presentation
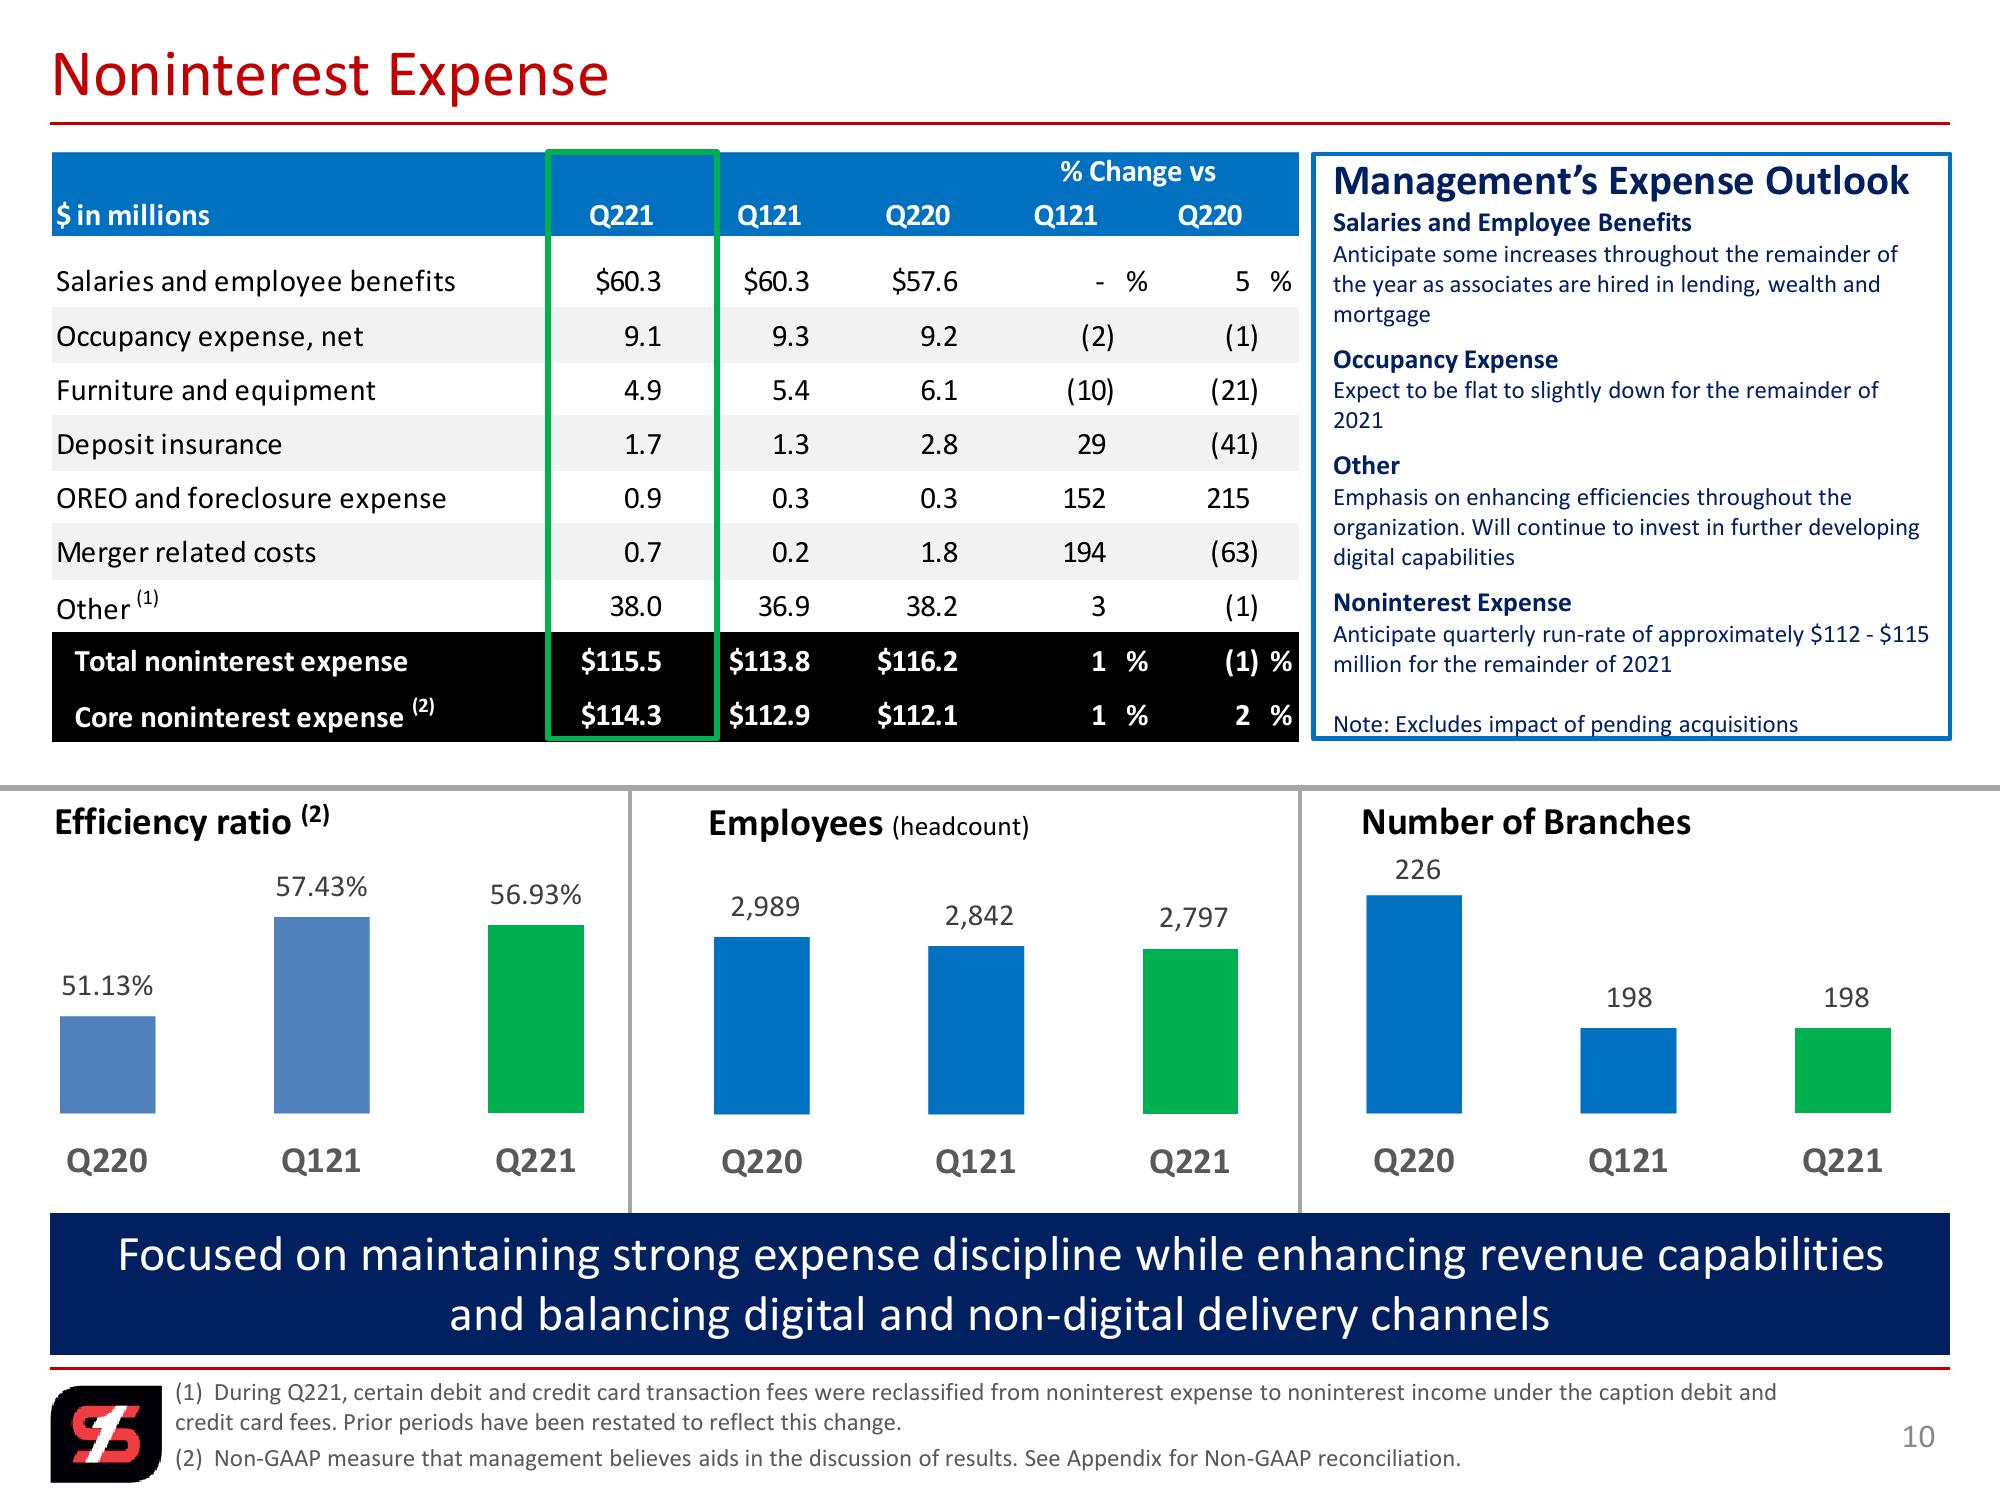
Noninterest Expense
$ in millions
Q221
Q121
Q220
Q121
% Change vs
Q220
Salaries and employee benefits
$60.3
$60.3
$57.6
-
%
5 %
Occupancy expense, net
9.1
9.3
9.2
(2)
(1)
Furniture and equipment
4.9
5.4
6.1
(10)
(21)
Management's Expense Outlook
Salaries and Employee Benefits
Anticipate some increases throughout the remainder of
the year as associates are hired in lending, wealth and
mortgage
Occupancy Expense
Expect to be flat to slightly down for the remainder of
2021
Deposit insurance
1.7
1.3
2.8
29
(41)
Other
OREO and foreclosure expense
0.9
0.3
0.3
152
215
Merger related costs
0.7
0.2
1.8
194
(63)
(1)
Other
38.0
36.9
38.2
3
(1)
Total noninterest expense
$115.5
$113.8
$116.2
1 %
(1) %
Emphasis on enhancing efficiencies throughout the
organization. Will continue to invest in further developing
digital capabilities
Noninterest Expense
Anticipate quarterly run-rate of approximately $112 - $115
million for the remainder of 2021
Core noninterest expense
(2)
$114.3
$112.9
$112.1
1%
2 %
Note: Excludes impact of pending acquisitions
Efficiency ratio (2)
Employees (headcount)
Number of Branches
226
57.43%
56.93%
2,989
2,842
2,797
51.13%
Q220
Q121
Q221
Q220
Q121
Q221
Q220
198
198
Q121
Q221
Focused on maintaining strong expense discipline while enhancing revenue capabilities
and balancing digital and non-digital delivery channels
(1) During Q221, certain debit and credit card transaction fees were reclassified from noninterest expense to noninterest income under the caption debit and
credit card fees. Prior periods have been restated to reflect this change.
(2) Non-GAAP measure that management believes aids in the discussion of results. See Appendix for Non-GAAP reconciliation.
$
10View entire presentation