Tradeweb Results Presentation Deck
Key Growth Initiatives
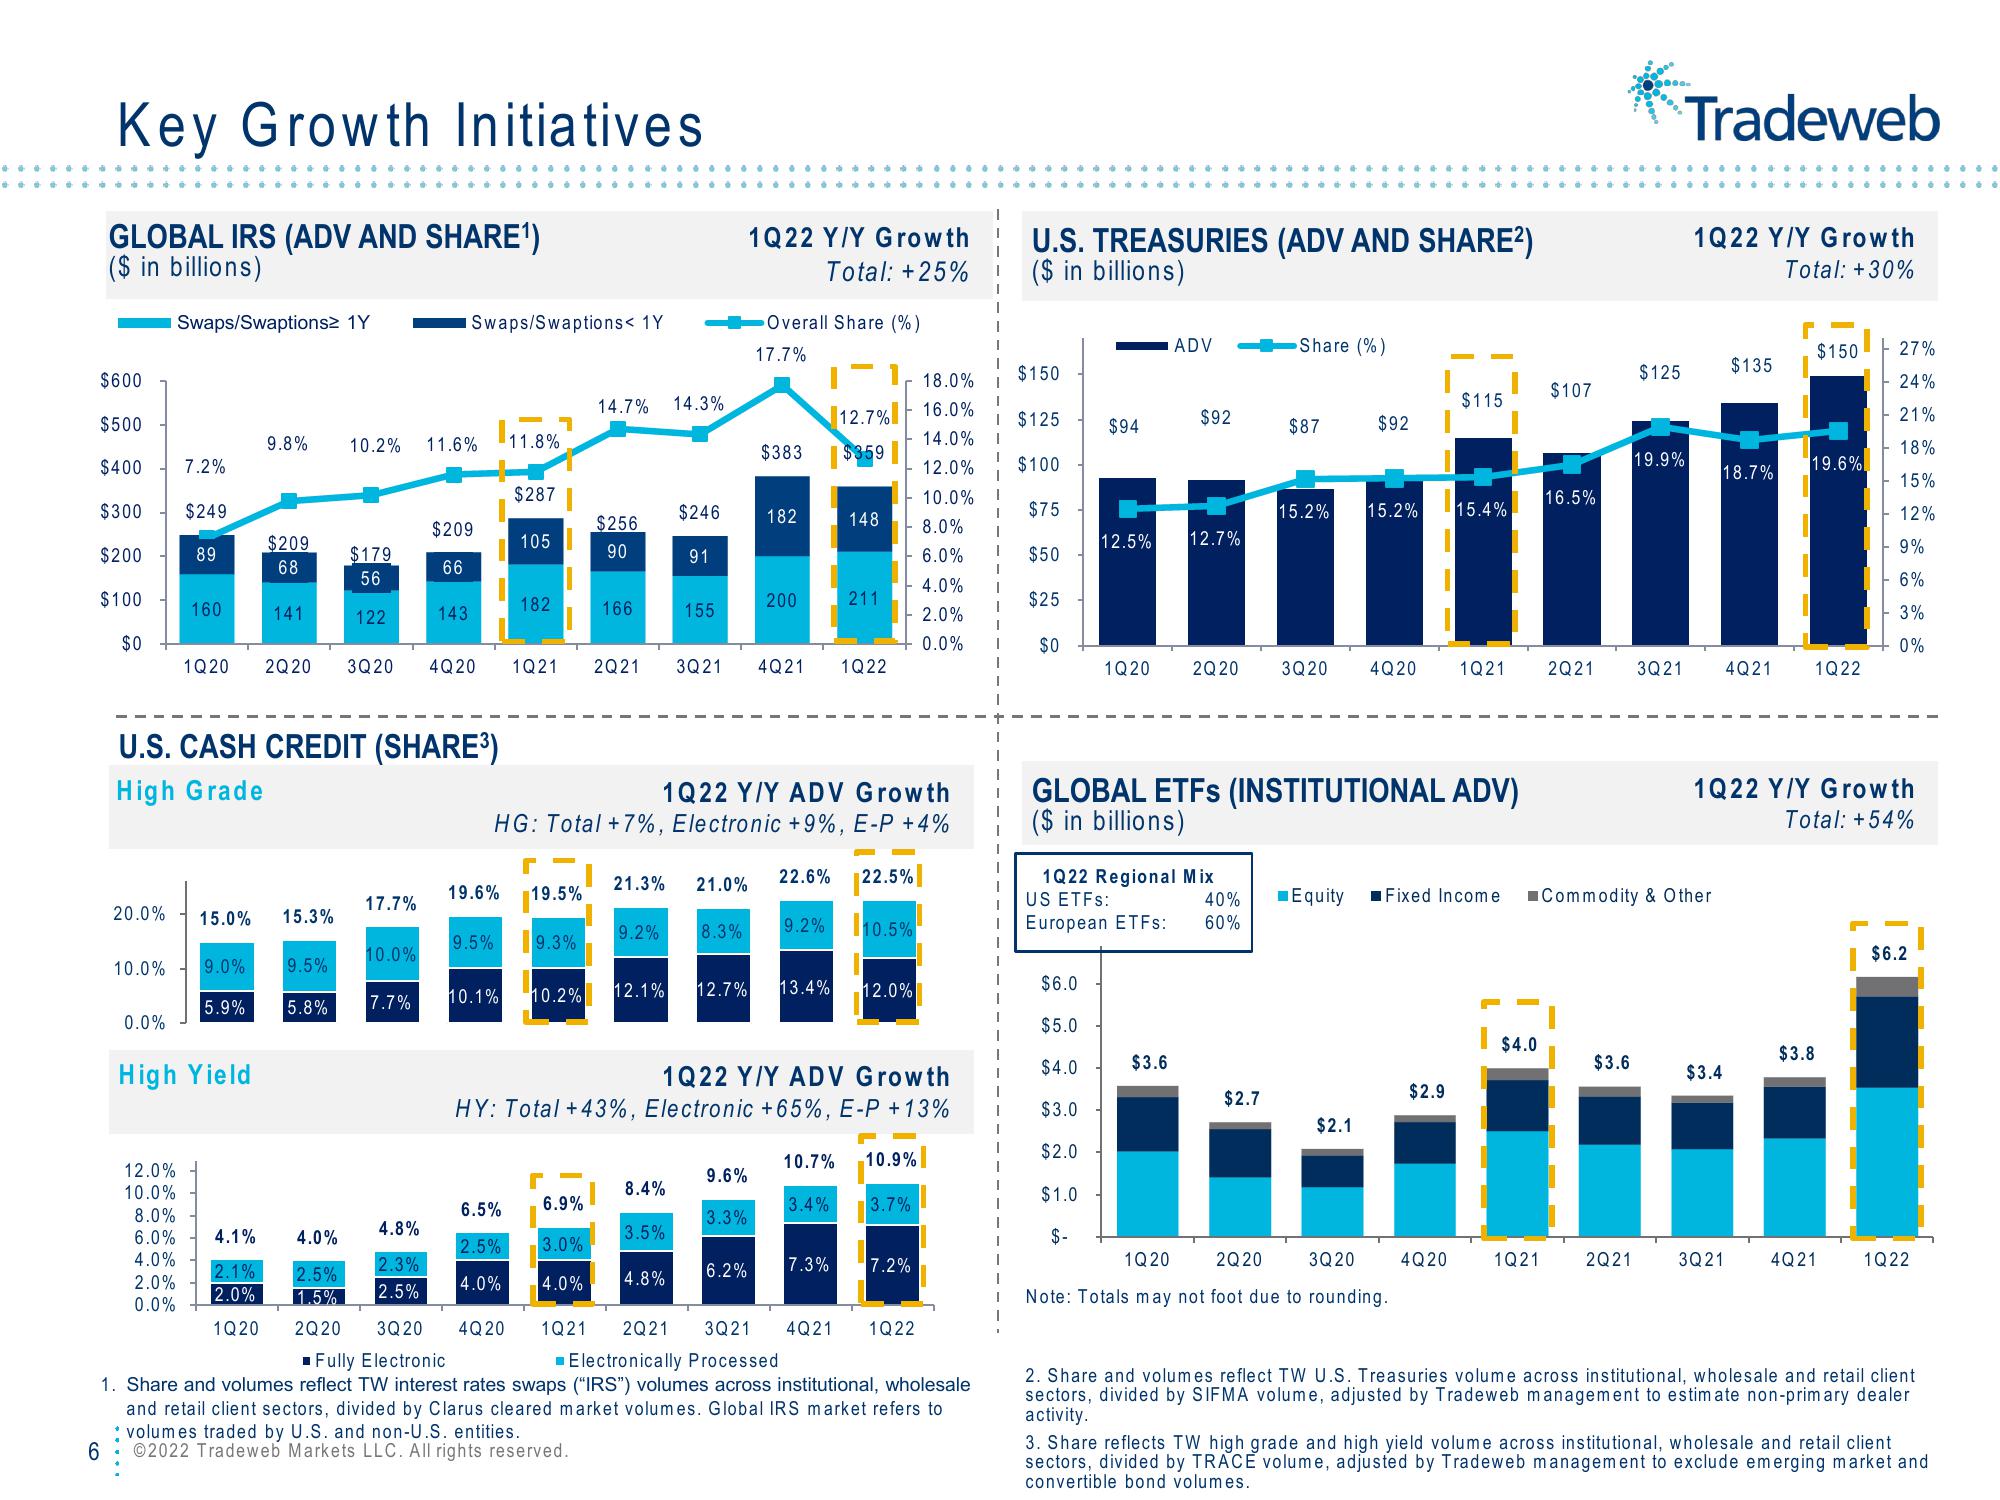
GLOBAL IRS (ADV AND SHARE¹)
($ in billions)
$600
$500
$400
$300 $249
$200
89
$100
$0
Swaps/Swaptions> 1Y
10.0%
0.0%
7.2%
160
12.0%
10.0%
9.8%
20.0% 15.0% 15.3%
$209
68
1Q20 2Q 20
High Yield
141
9.0% 9.5%
5.9%
5.8%
2.1%
2.0%
1Q20
8.0%
6.0% 4.1% 4.0%
4.0%
2.0%
0.0%
10.2%
$179
56
U.S. CASH CREDIT (SHARE³)
High Grade
122
3Q20
17.7%
10.0%
7.7%
4.8%
2.3%
2.5%
Swaps/Swaptions< 1Y
11.6%
$209
66
143
11.8%
$287
105
182
14.7%
$256
90
166
4Q20 1Q21 2Q21
9.2%
14.3%
$246
r
6.5% 6.9%
2.5% 3.0%
4.0% 4.0% 4.8%
91
8.4%
155
21.3% 21.0%
3.5%
1Q22 Y/Y Growth
Total: +25%
Overall Share (%)
17.7%
$383
182
1Q22 Y/Y ADV Growth
HG: Total +7%, Electronic +9%, E-P + 4%
r
19.6% 19.5%
9.5% 9.3%
10.1% 10.2% 12.1% 12.7% 13.4% 12.0%
9.6%
3.3%
200
6.2%
3Q21 4Q21 1Q22
12.7%
$359
148
211
9.2%
8.3%
1Q22 Y/Y ADV Growth
HY: Total +43%, Electronic +65%, E-P+13%
22.6% 22.5%
7.3%
10.5%
F
10.7% 10.9%
3.4%
3.7%
7.2%
2.5%
1.5%
2Q20 3Q20 4Q 20
1Q21 2Q21 3Q21 4Q21 1Q22
■ Fully Electronic.
Electronically Processed
1. Share and volumes reflect TW interest rates swaps ("IRS") volumes across institutional, wholesale
and retail client sectors, divided by Clarus cleared market volumes. Global IRS market refers to
* volumes traded by U.S. and non-U.S. entities.
6
Ⓒ2022 Tradeweb Markets LLC. All rights reserved.
I
18.0%
16.0%
I $125
14.0% 1
12.0% $100
10.0% 1
1
8.0% 1
$75
6.0% I $50
4.0%
2.0%
I
1
$25
0.0%
U.S. TREASURIES (ADV AND SHARE²)
($ in billions)
$150
$0
$94
$6.0
$5.0
$4.0
$3.0
$2.0
$1.0
$-
ADV
$92
12.5% 12.7%
1Q20 2Q20
1Q22 Regional Mix
US ETFS:
40%
60%
European ETFs:
$3.6
Share (%)
$2.7
$87
15.2%
GLOBAL ETFS (INSTITUTIONAL ADV)
($ in billions)
$92
3Q20 4Q20
■Equity
$2.1
15.2% 15.4%
$115
Fixed Income
$2.9
1Q20 2Q20
Note: Totals may not foot due to rounding.
3Q20 4Q20
1Q21
$4.0
1Q21
$107
16.5%
2Q21
$3.6
$125
2Q21
19.9%
3Q21
Tradeweb
1Q22 Y/Y Growth
Total: +30%
Commodity & Other
$3.4
$135
18.7%
4Q21
3Q21
$150 -27%
24%
21%
18%
15%
12%
9%
6%
19.6%
1Q22 Y/Y Growth
Total: +54%
1Q22
$3.8
3%
0%
$6.2
4Q21 1Q22
2. Share and volumes reflect TW U.S. Treasuries volume across institutional, wholesale and retail client
sectors, divided by SIFMA volume, adjusted by Tradeweb management to estimate non-primary dealer
activity.
3. Share reflects TW high grade and high yield volume across institutional, wholesale and retail client
sectors, divided by TRACE volume, adjusted by Tradeweb management to exclude emerging market and
convertible bond volumes.View entire presentation