Nerdy Investor Presentation Deck
1
2
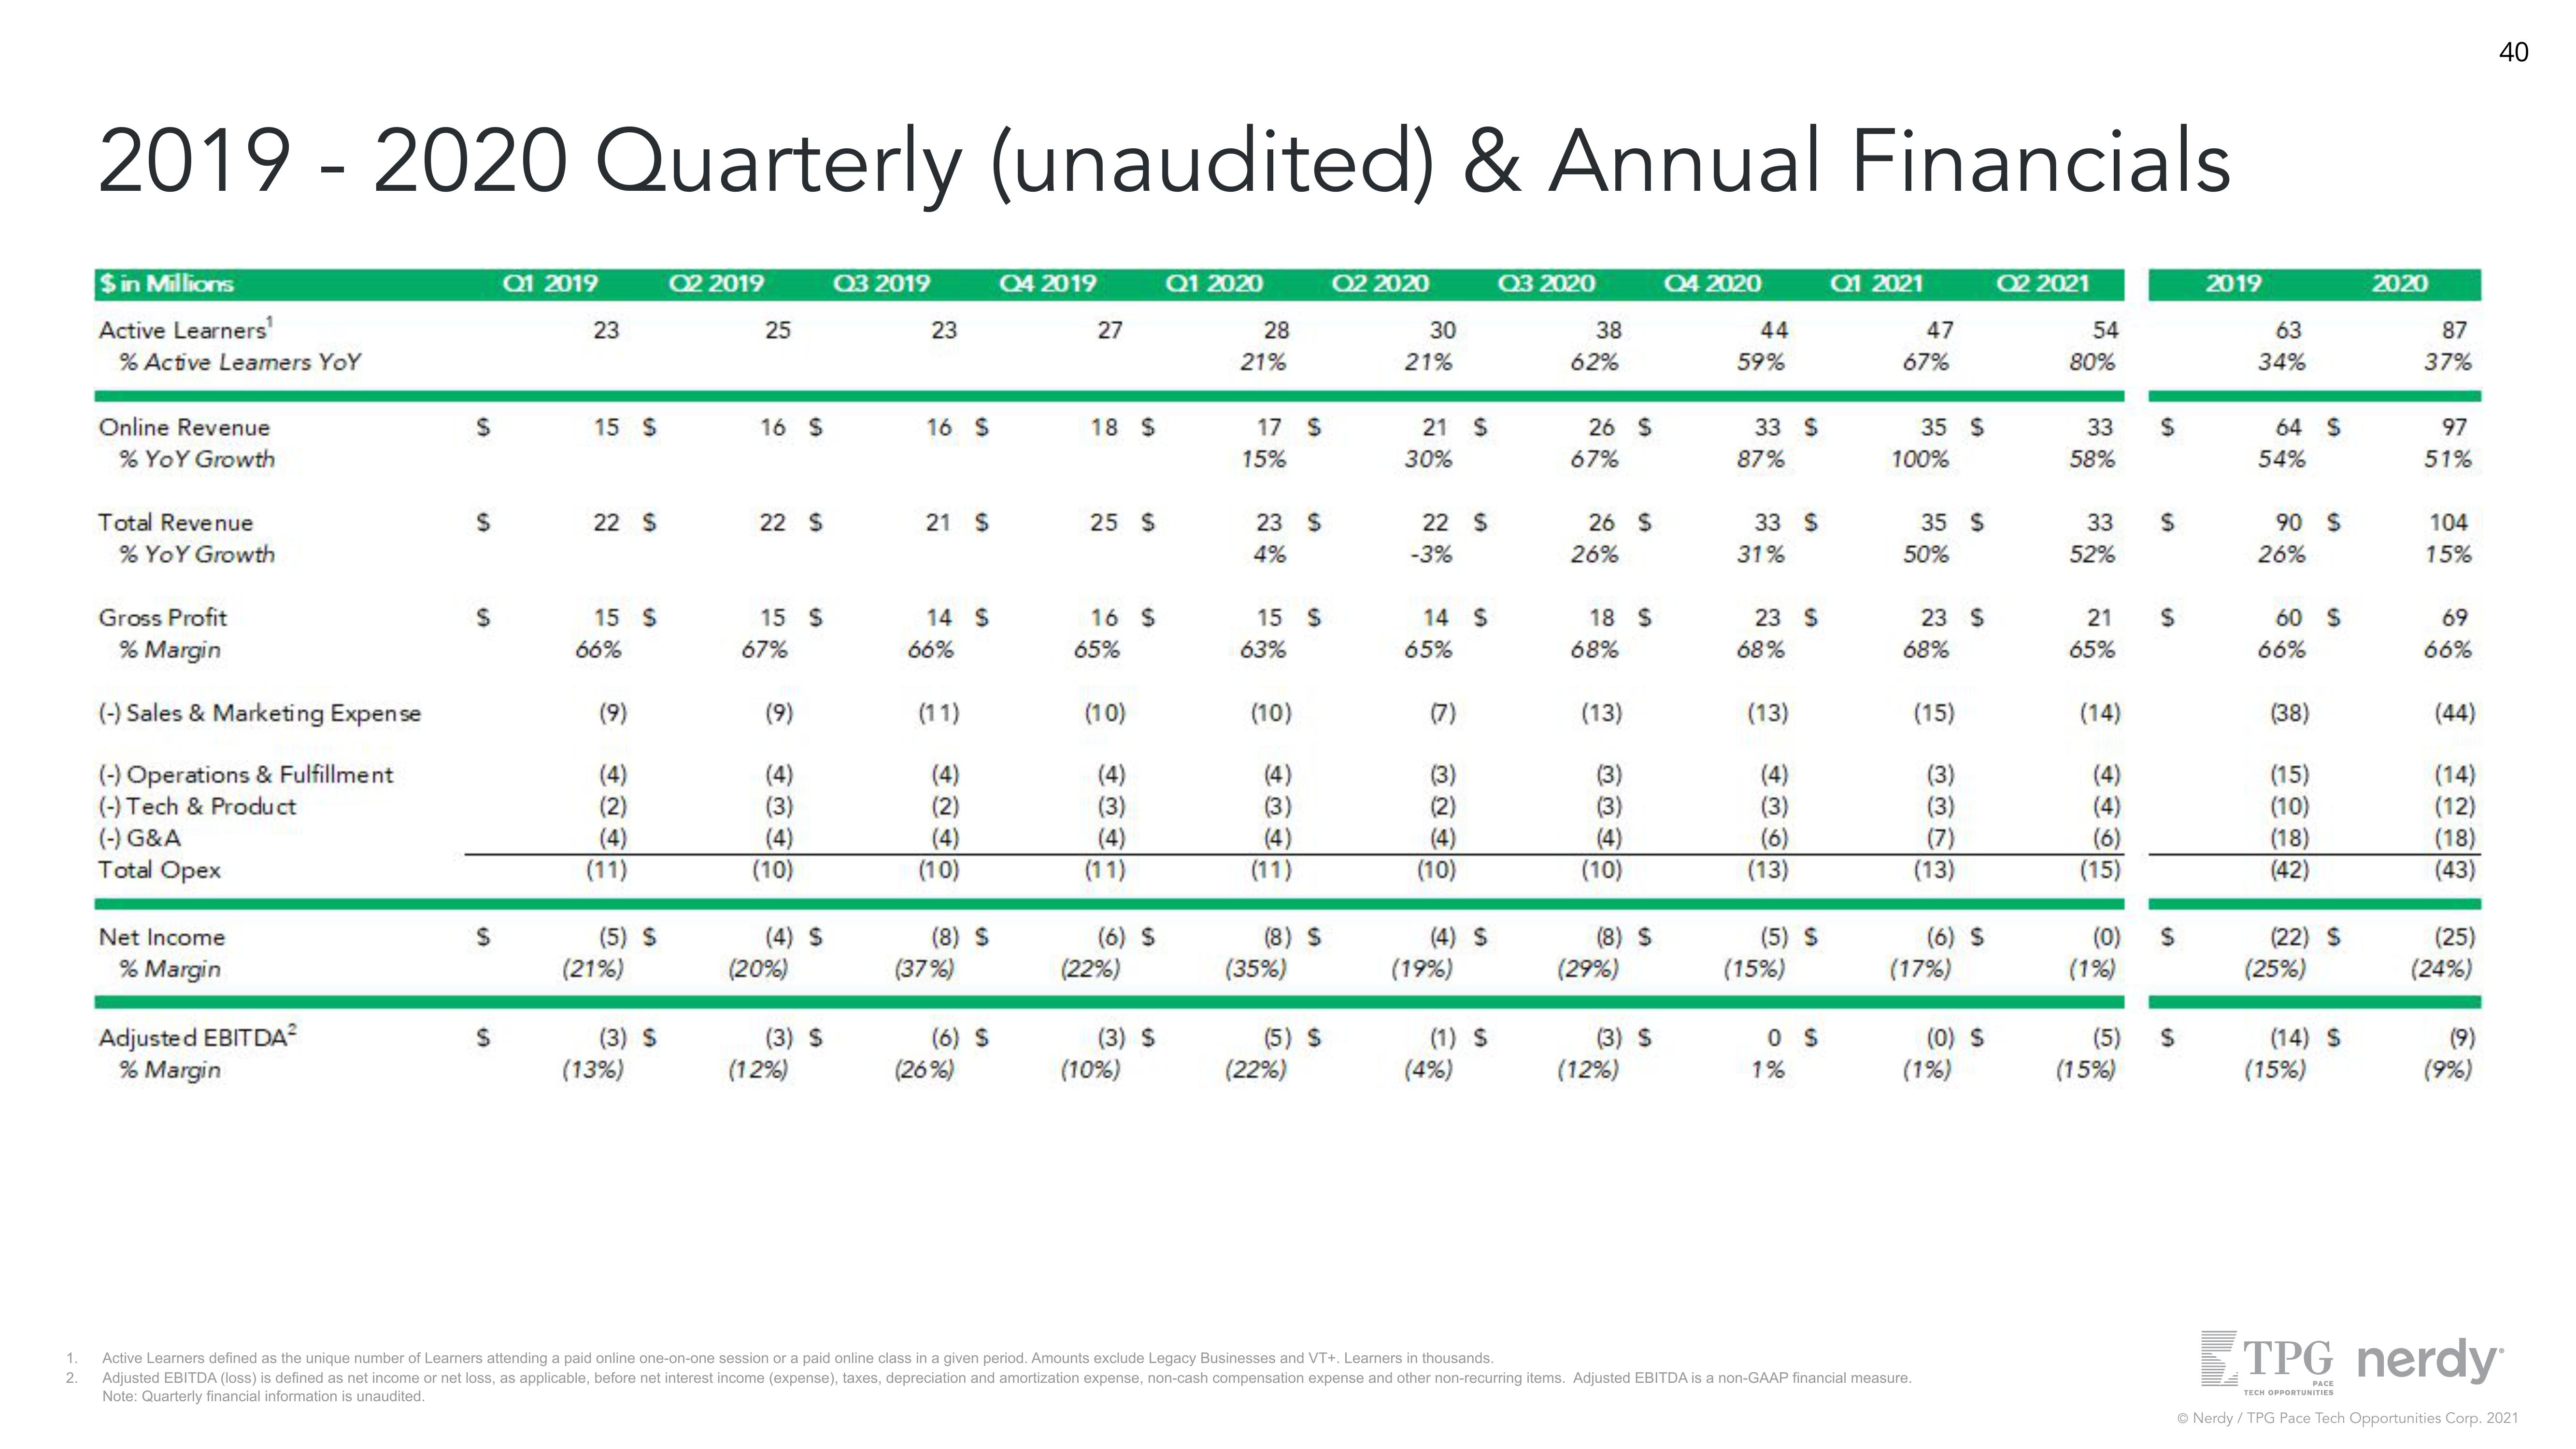
2019-2020 Quarterly (unaudited) & Annual Financials
$ in Millions
Active Learners¹
% Active Leamers YoY
Online Revenue
% YoY Growth
Total Revenue
% YoY Growth
Gross Profit
% Margin
(-) Sales & Marketing Expense
(-) Operations & Fulfillment
(-) Tech & Product
(-) G&A
Total Opex
Net Income
% Margin
Adjusted EBITDA²
% Margin
$
$
S
$
S
Q1 2019
23
15 S
22 S
15 S
66%
(9)
(4)
(2)
(4)
(11)
(5) S
(21%)
(3) S
(13%)
Q2 2019
25
16 S
22 S
15 S
67%
(9)
(4)
(3)
(4)
(10)
(4) S
(20%)
(3) S
(12%)
Q3 2019
23
16 S
21 S
14 S
66%
(11)
(4)
(2)
(4)
(10)
(8) S
(37%)
(6) S
(26%)
Q4 2019
27
18 S
25 $
16 S
65%
(10)
(4)
(3)
(4)
(11)
(6) S
(22%)
(3) S
(10%)
Q1 2020
28
21%
17 S
15%
23 S
4%
15 S
63%
(10)
(4)
(3)
(4)
(11)
(8) S
(35%)
(5) S
(22%)
Q2 2020
30
21%
21 S
30%
22 S
-3%
14 S
65%
(7)
(3)
(2)
(4)
(10)
(4) S
(19%)
(1) S
(4%)
Q3 2020
38
62%
26 S
67%
26 $
26%
18 S
68%
(13)
(3)
(3)
(4)
(10)
(8) S
(29%)
(3) S
(12%)
Q4 2020
44
59%
33 S
87%
33 S
31%
23 S
68%
(13)
(4)
(3)
(6)
(13)
(5) S
(15%)
0 S
1%
Q1 2021
47
67%
35 $
100%
35 $
50%
23 S
68%
(15)
(3)
(3)
(7)
(13)
(6) S
(17%)
Active Learners defined as the unique number of Learners attending a paid online one-on-one session or a paid online class in a given period. Amounts exclude Legacy Businesses and VT+. Learners in thousands.
Adjusted EBITDA (loss) is defined as net income or net loss, as applicable, before net interest income (expense), taxes, depreciation and amortization expense, non-cash compensation expense and other non-recurring items. Adjusted EBITDA is a non-GAAP financial measure.
Note: Quarterly financial information is unaudited.
(0) S
(1%)
02 2021
54
80%
33
58%
33
52%
21
65%
(14)
(4)
(4)
(6)
(15)
(1%)
$
(5)
(15%)
$
(0) $
$
S
2019
63
34%
64 S
54%
90 S
26%
60 S
66%
(38)
(15)
(10)
(18)
(42)
(22) S
(25%)
(14) S
(15%)
2020
87
37%
97
51%
104
15%
69
66%
(44)
(14)
(12)
(18)
(43)
(25)
(24%)
(9)
(9%)
40
TPG nerdy
PACE
TECH OPPORTUNITIES
Ⓒ Nerdy / TPG Pace Tech Opportunities Corp. 2021View entire presentation