Evercore Investment Banking Pitch Book
Financial Analysis
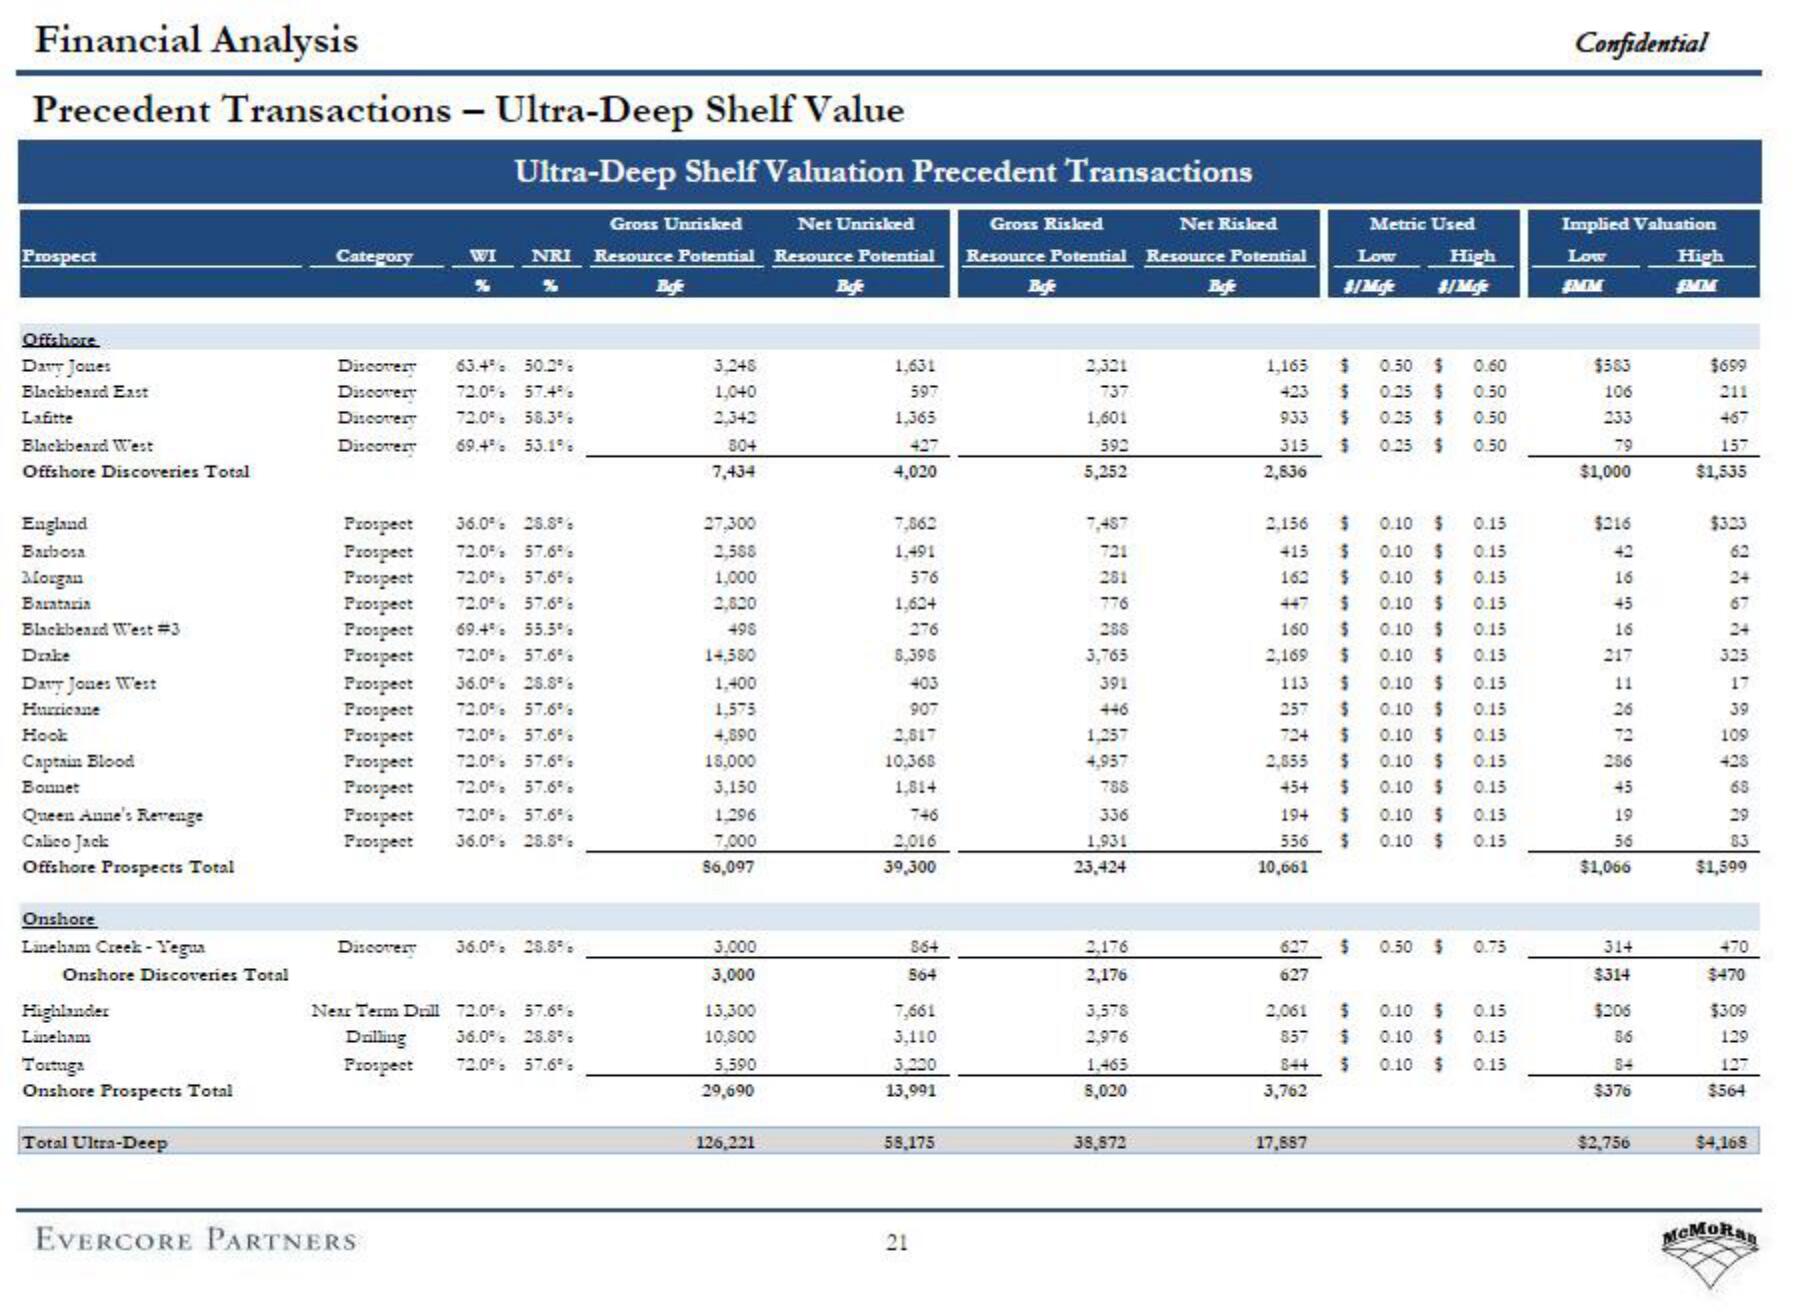
Precedent Transactions - Ultra-Deep Shelf Value
Prospect
Offshore
Davy Jones
Blackbeard East
Lafitte
Blackbeard West
Offshore Discoveries Total
England
Barbosa
Morgan
Barataria
Blackbeard West #3
Drake
Davy Jones West
Hurricane
Hook
Captain Blood
Bonnet
Queen Anne's Revenge
Calico Jack
Offshore Prospects Total
Onshore
Lineham Creek-Yegua
Onshore Discoveries Total
Highlander
Lineham
Tortuga
Onshore Prospects Total
Total Ultra-Deep
Category
WI
%
Ultra-Deep Shelf Valuation Precedent Transactions
Gross Unrisked
NRI Resource Potential
Discovery 63.4% 50.0%
Discovery 72.0% 57.4%
Discovery 72.0% 58.3%
Discovery 69.4% 53.1%
Prospect 36.0% 28.8%
Prospect 72.0% 57.6%
Prospect 72.0% 57.6%
Prospect 72.0% 57.6%
Prospect 69.4% 55.3%
Prospect 72.0% 57.6%
Prospect 36.0% 28.8%
Prospect 72.0% 57.6%
Prospect 72.0% 57.6%
Prospect 72.0% 57.6%
Prospect 72.0% 57.6%
Prospect 72.0% 57.6%
Prospect 36.0% 28.8%
EVERCORE PARTNERS
Discovery 36.0% 28.8%
Near Term Drill 72.0% 57.6%
Drilling
36.0% 28.8%
Prospect 72.0% 57.6%
Befe
3,248
1,040
2,342
804
7,434
27,300
2,588
1,000
2,820
498
14,580
1,400
1,575
4,890
18,000
3,150
1.296
7,000
$6,097
3.000
3,000
13,300
10,800
5,590
29,690
126,221
Net Unrisked
Resource Potential
Befe
1,631
597
1,365
427
4,020
7,862
1,491
576
1,624
276
8,395
403
907
2,817
10.368
1.814
746
2,016
39,300
864
564
7,661
3,110
3,220
13,991
58,175
21
Gross Risked
Net Risked
Resource Potential Resource Potential
Befe
2,321
737
1,601
592
5,252
7,487
281
776
288
3,765
391
446
1.257
4.957
788
336
1.931
23,424
2,176
2,176
3.578
2,976
1.465
8,020
38,872
Befe
1,165
423
933
315
2,836
2,156
$
415 $
162
$
$
160
$
2,169 $
113
257
724
$
$
2,855
10,661
627
627
Low
4/Mofe
454 5
194 $
556 S
3,762
$ 0.50 $
$
$
0.25 $
0.25 $
0.25 $
$
17,887
in in
Metric Used
0.15
0.15
0.15
0.15
0.15
0.10 $
0.10 $
0.10 $
0.10 $
0.10 $
0.10 $ 0.15
0.10 $ 0.15
0.10 $ 0.15
$ 0.10 S 0.15
0.10 S
0.10 S
0.15
0.15
0.15
0.10 $
0.10 $
0.15
2,061
S
857
$
844 $
$
High
0.60
0.50
0.50
0.50
0.10 S
0.10 $
0.10 S
0.50 $ 0.75
0.15
0.15
0.15
Confidential
Implied Valuation
Low
SMM
$563
106
233
79
$1,000
$216
42
16
45
16
217
11
26
286
45
19
56
$1,066
314
$314
$206
56
84
$376
$2,756
High
SMM
$699
211
467
157
$1,535
$323
62
24
67
325
17
39
109
428
68
83
$1,599
470
$470
$309
129
127
$564
$4,168
McMoRanView entire presentation