jetBlue Results Presentation Deck
TAKING ACTIONS TO PROTECT OUR STAKEHOLDERS
●
●
●
4Q 2020 BALANCE SHEET
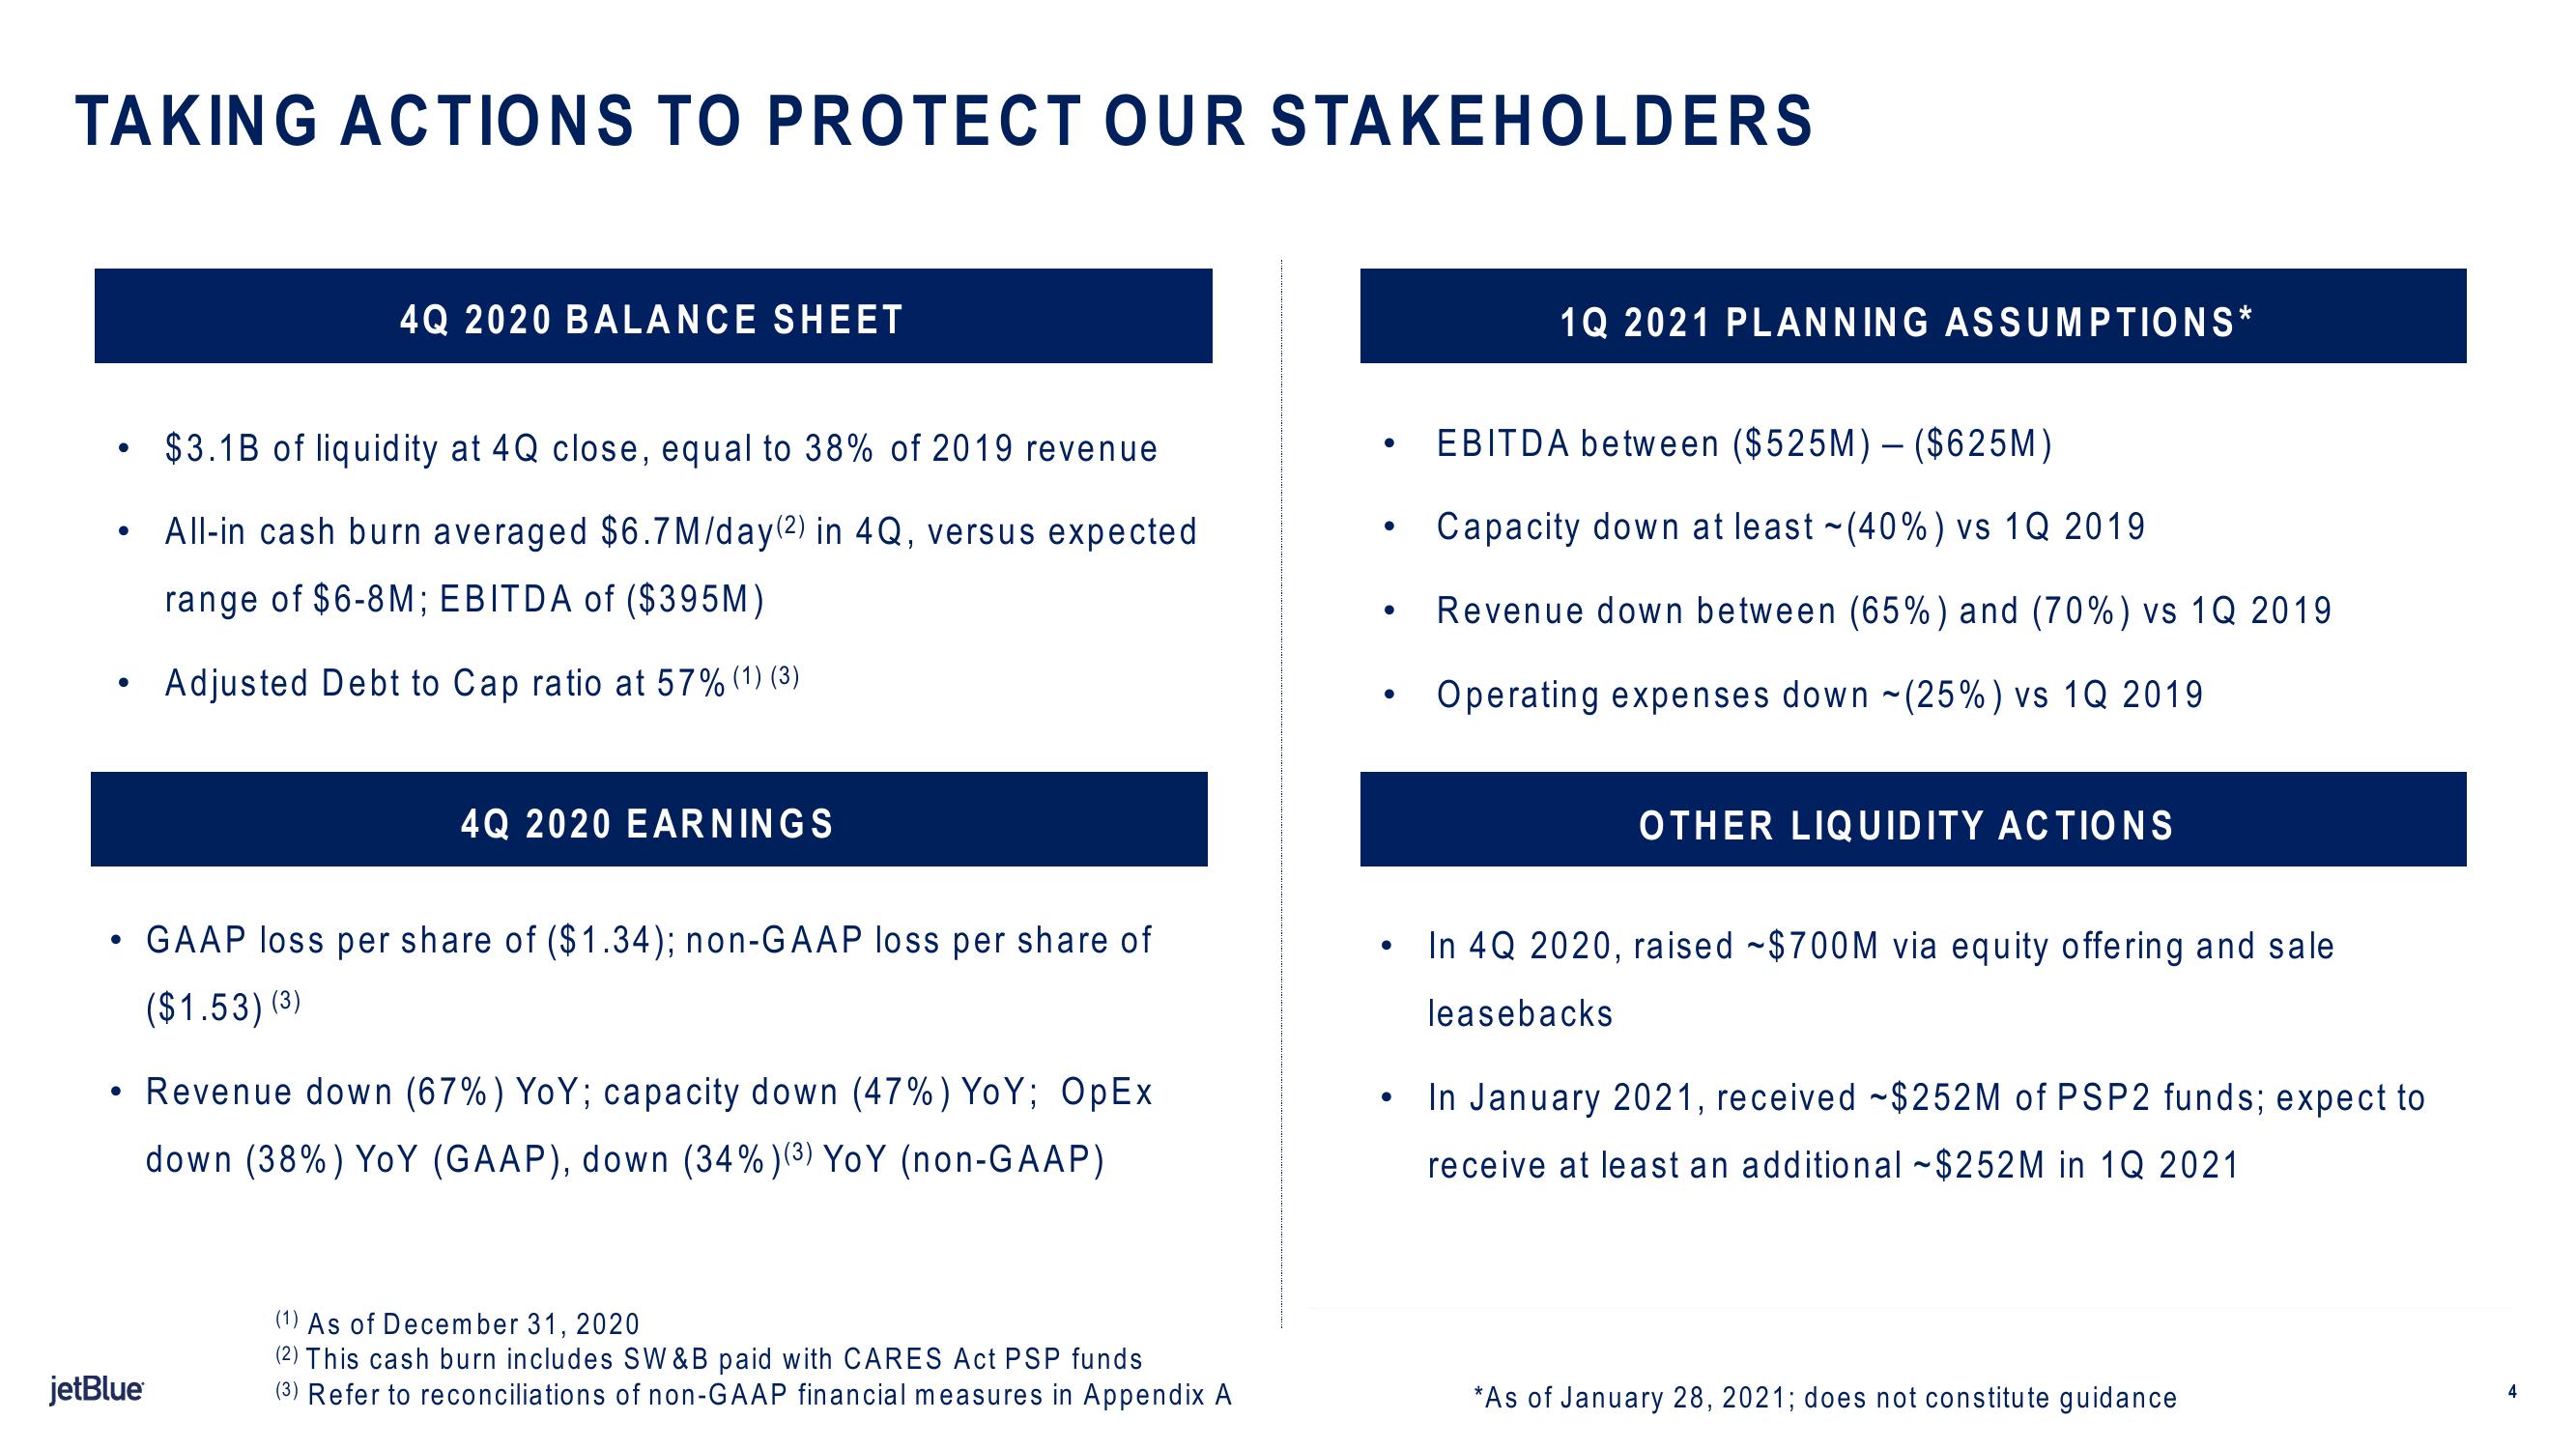
$3.1B of liquidity at 4Q close, equal to 38% of 2019 revenue
All-in cash burn averaged $6.7M/day (2) in 4Q, versus expected
range of $6-8M; EBITDA of ($395M)
Adjusted Debt to Cap ratio at 57% (1) (3)
jetBlue
4Q 2020 EARNINGS
GAAP loss per share of ($1.34); non-GAAP loss per share of
($1.53) (3)
• Revenue down (67%) YoY; capacity down (47%) YoY; OpEx
down (38%) YoY (GAAP), down (34%)(3) YoY (non-GAAP)
(1) As of December 31, 2020
(2) This cash burn includes SW & B paid with CARES Act PSP funds
(3) Refer to reconciliations of non-GAAP financial measures in Appendix A
●
●
●
●
●
1Q 2021 PLANNING ASSUMPTIONS*
EBITDA between ($525M) - ($625M)
Capacity down at least ~(40%) vs 1Q 2019
Revenue down between (65%) and (70%) vs 1Q 2019
Operating expenses down (25%) vs 1Q 2019
-
OTHER LIQUIDITY ACTIONS
In 4Q 2020, raised $700M via equity offering and sale
leasebacks
In January 2021, received -$252M of PSP2 funds; expect to
receive at least an additional ~$252M in 1Q 2021
*As of January 28, 2021; does not constitute guidance
4View entire presentation