Commercial Metals Company Results Presentation Deck
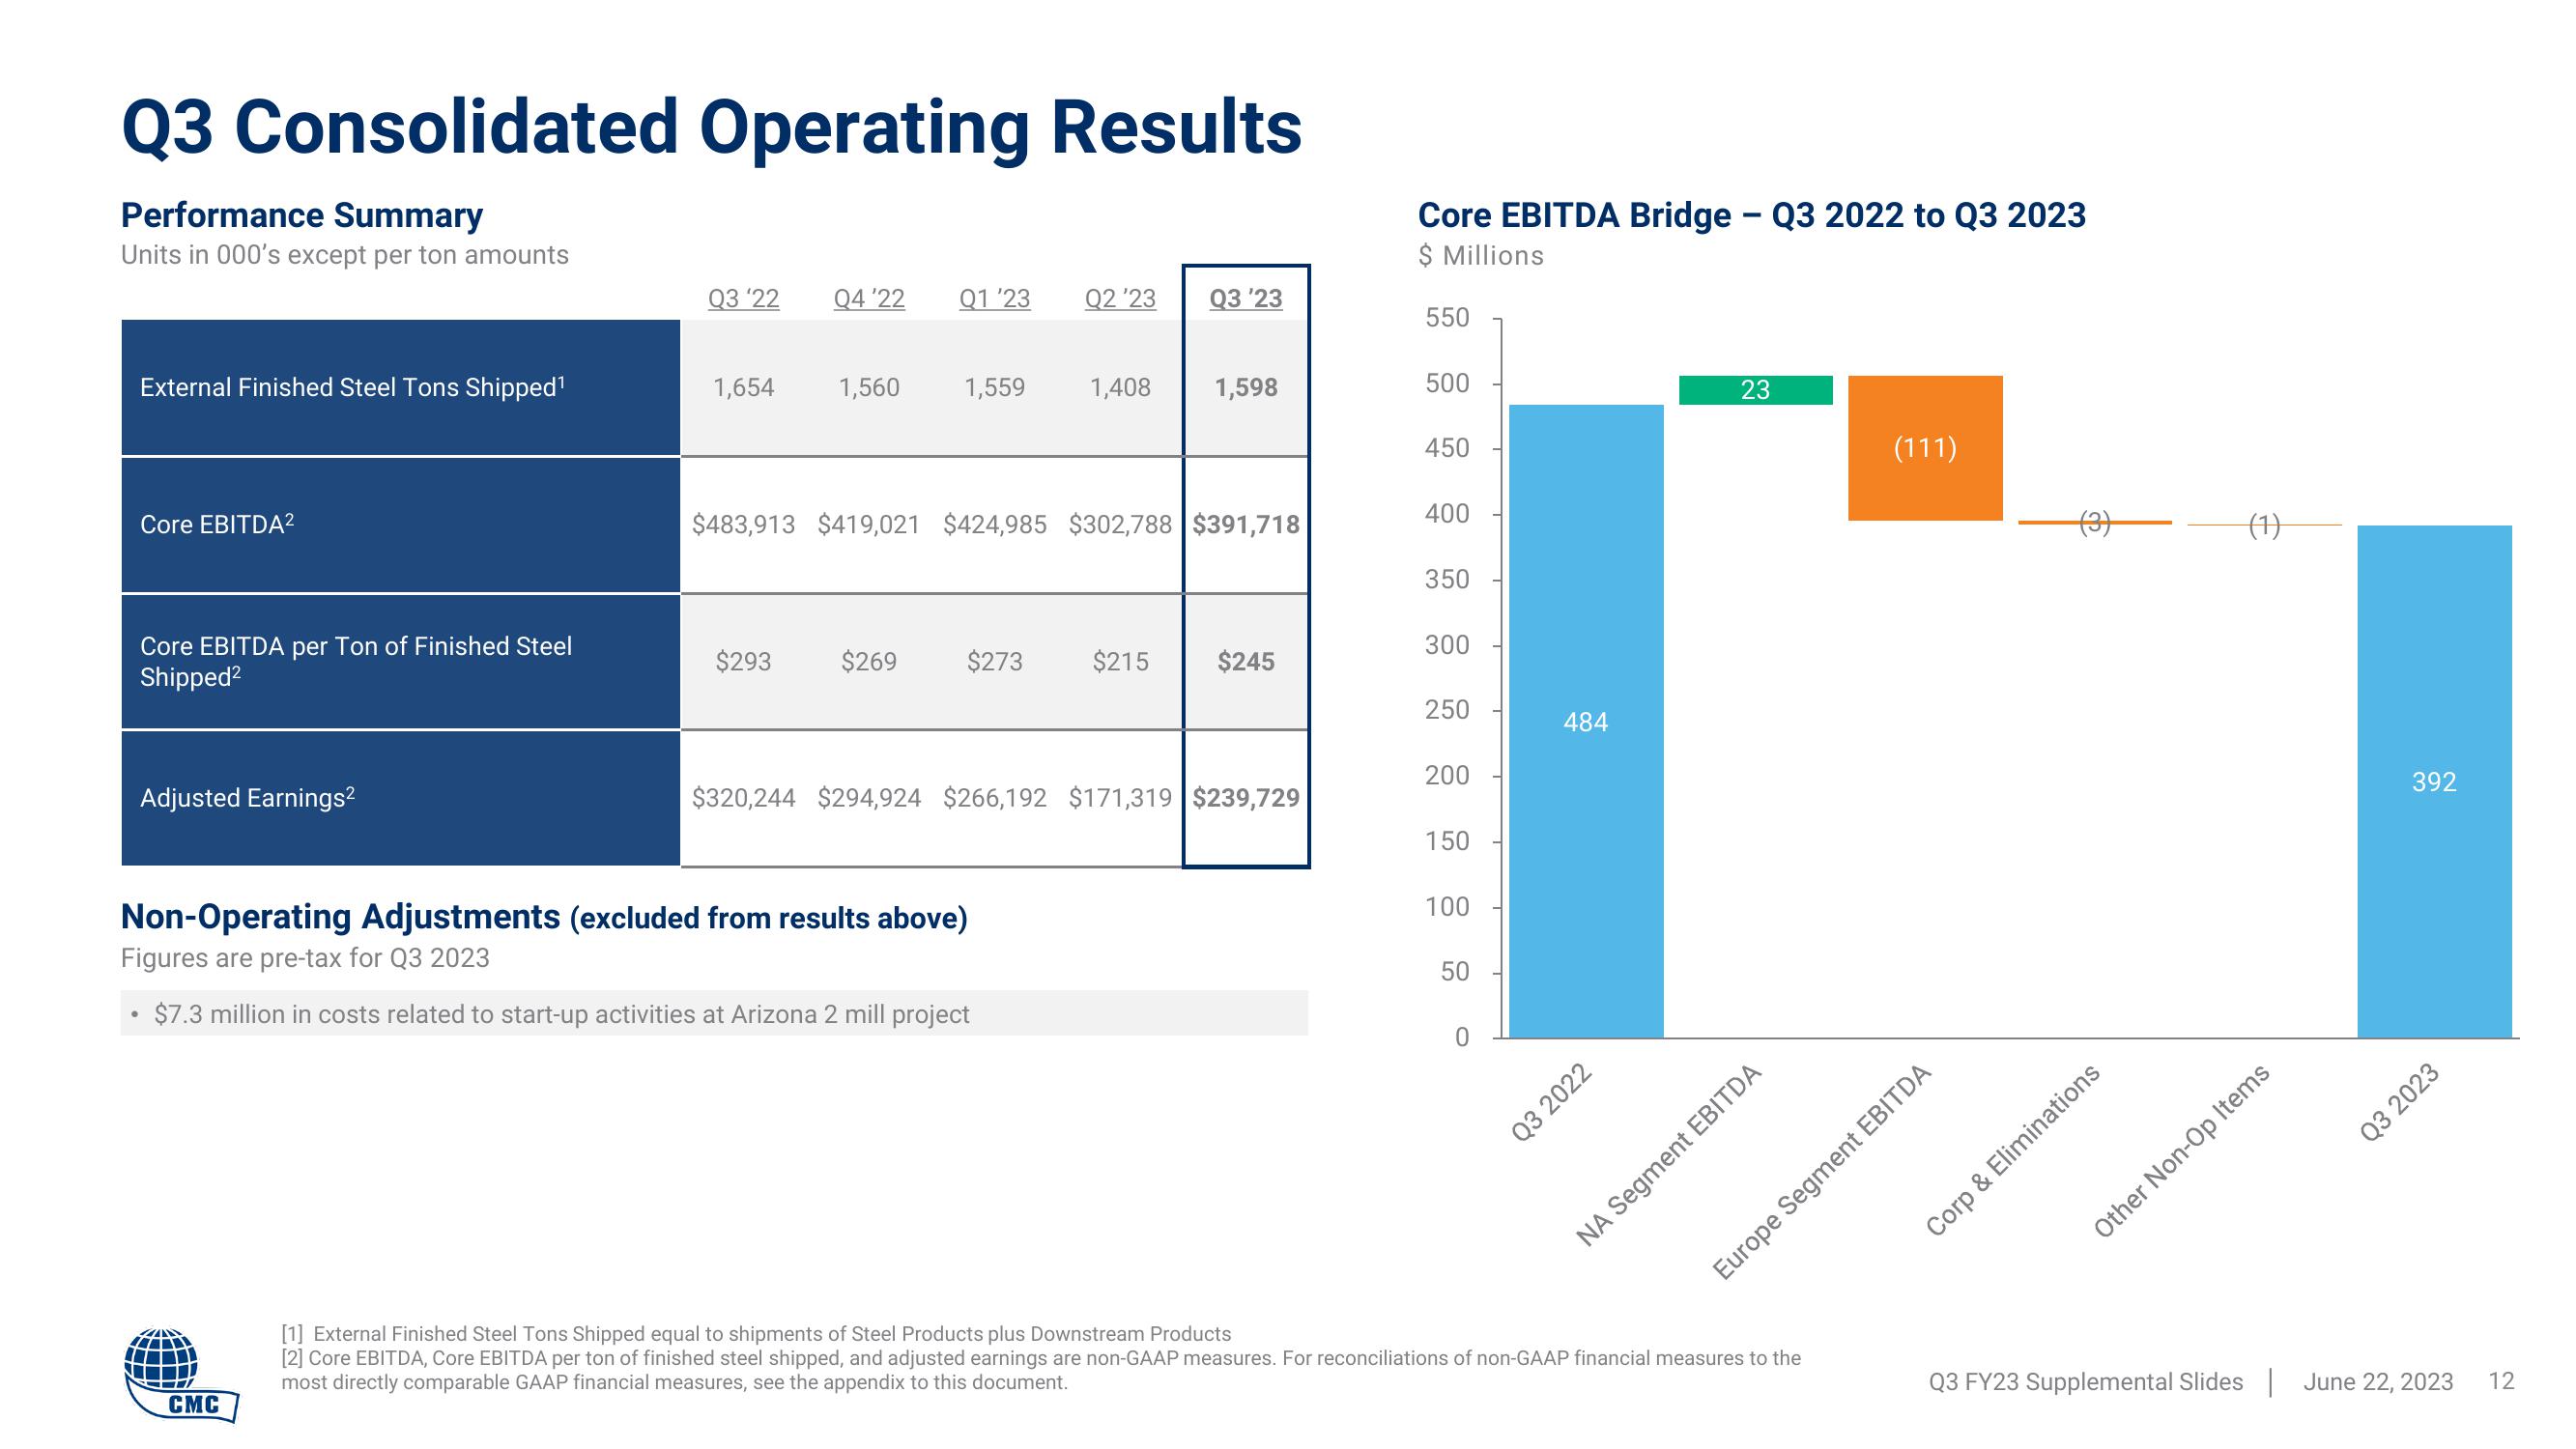
Q3 Consolidated Operating Results
Performance Summary
Units in 000's except per ton amounts
External Finished Steel Tons Shipped¹
Core EBITDA²
Core EBITDA per Ton of Finished Steel
Shipped²
Adjusted Earnings²
Q3 '22
CMC
1,654
Q4 '22
1,560
Q1 '23
1,559
Q2 '23
1,408
Non-Operating Adjustments (excluded from results above)
Figures are pre-tax for Q3 2023
$7.3 million in costs related to start-up activities at Arizona 2 mill project
Q3 '23
1,598
$483,913 $419,021 $424,985 $302,788 $391,718
$293 $269 $273 $215 $245
$320,244 $294,924 $266,192 $171,319 $239,729
Core EBITDA Bridge - Q3 2022 to Q3 2023
$ Millions
550
500
450
400
350
300
250
200
150
100
50
0
484
23
Q3 2022
NA Segment EBITDA
(111)
[1] External Finished Steel Tons Shipped equal to shipments of Steel Products plus Downstream Products
[2] Core EBITDA, Core EBITDA per ton of finished steel shipped, and adjusted earnings are non-GAAP measures. For reconciliations of non-GAAP financial measures to the
most directly comparable GAAP financial measures, see the appendix to this document.
////
Europe Segment EBITDA
(1)
Corp & Eliminations
Other Non-Op Items
392
Q3 2023
Q3 FY23 Supplemental Slides June 22, 2023
12View entire presentation