Credit Suisse Investment Banking Pitch Book
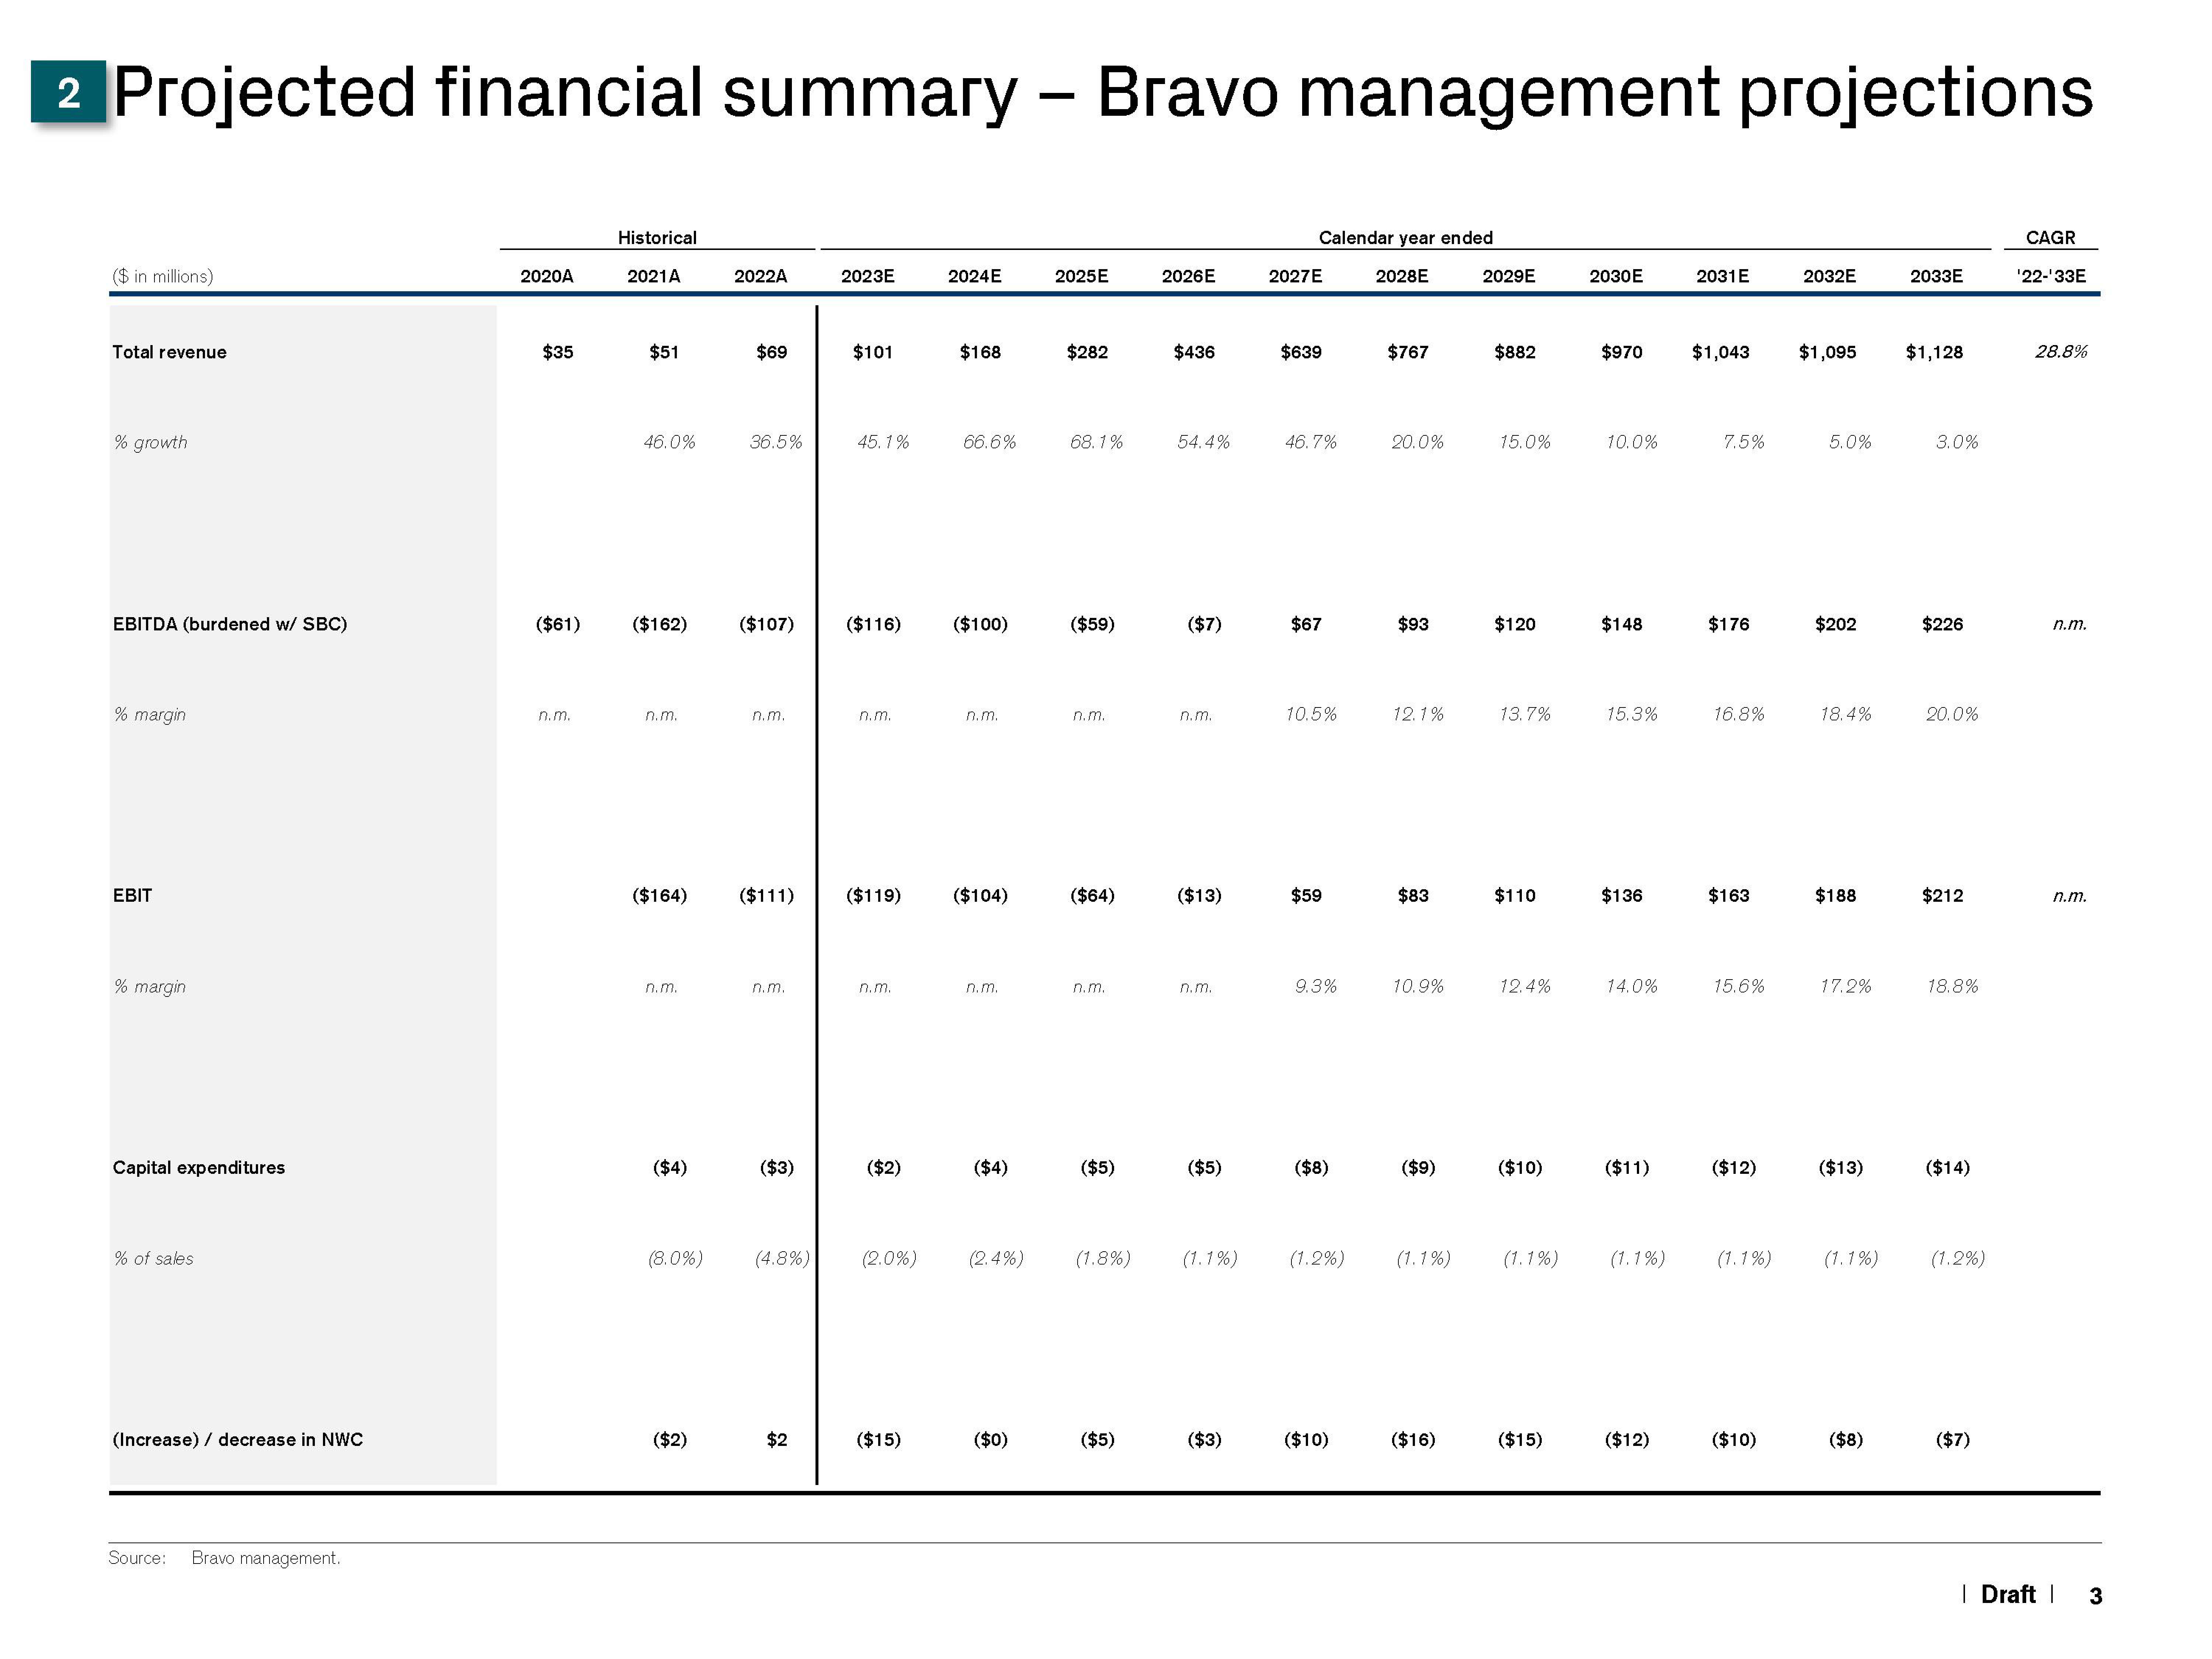
2 Projected financial summary - Bravo management projections
Calendar year ended
2028E
($ in millions)
Total revenue
% growth
EBITDA (burdened w/ SBC)
% margin
EBIT
% margin
Capital expenditures
% of sales
(Increase) / decrease in NWC
Source:
Bravo management.
2020A
$35
($61)
n.m.
Historical
2021A
$51
46.0%
($162)
n.m.
($164)
n.m.
($4)
2022A
($2)
$69
36.5%
($107)
n.m.
($111)
n.m.
($3)
(8.0%) (4.8%)
$2
2023E
$101
45.1%
n.m.
($119)
($116) ($100)
n.m.
($2)
(2.0%)
2024E
($15)
$168
66.6%
n.m.
($104)
n.m.
($4)
2025E
($0)
$282
68.1%
($59)
n.m.
($64)
n.m.
($5)
2026E
($5)
$436
54.4%
($7)
n.m.
($13)
n.m.
(2.4%) (1.8%) (1.1%)
($5)
($3)
2027E
$639
46.7%
$67
10.5%
$59
9.3%
($8)
(1.2%)
($10)
$767
20.0%
$93
12.1%
$83
10.9%
($9)
(1.1%)
($16)
2029E
$882
15.0%
$120
13.7%
$110
12.4%
($10)
(1.1%)
($15)
2030E
$970
10.0%
$148
15.3%
$136
14.0%
($11)
(1.1%)
($12)
2031E
$1,043
7.5%
$176
16.8%
$163
15.6%
($12)
2032E
($10)
$1,095
5.0%
$202
18.4%
$188
17.2%
($13)
2033E
($8)
$1,128
3.0%
$226
20.0%
$212
18.8%
(1.1%) (1.1%) (1.2%)
($14)
($7)
CAGR
'22-'33E
28.8%
n.m.
n.m.
| Draft |
3View entire presentation