OmniAb Investor Conference Presentation Deck
Key Performance Indicators
TECHNOLOGY AND BUSINESS MODEL ARE HIGHLY SCALABLE
●
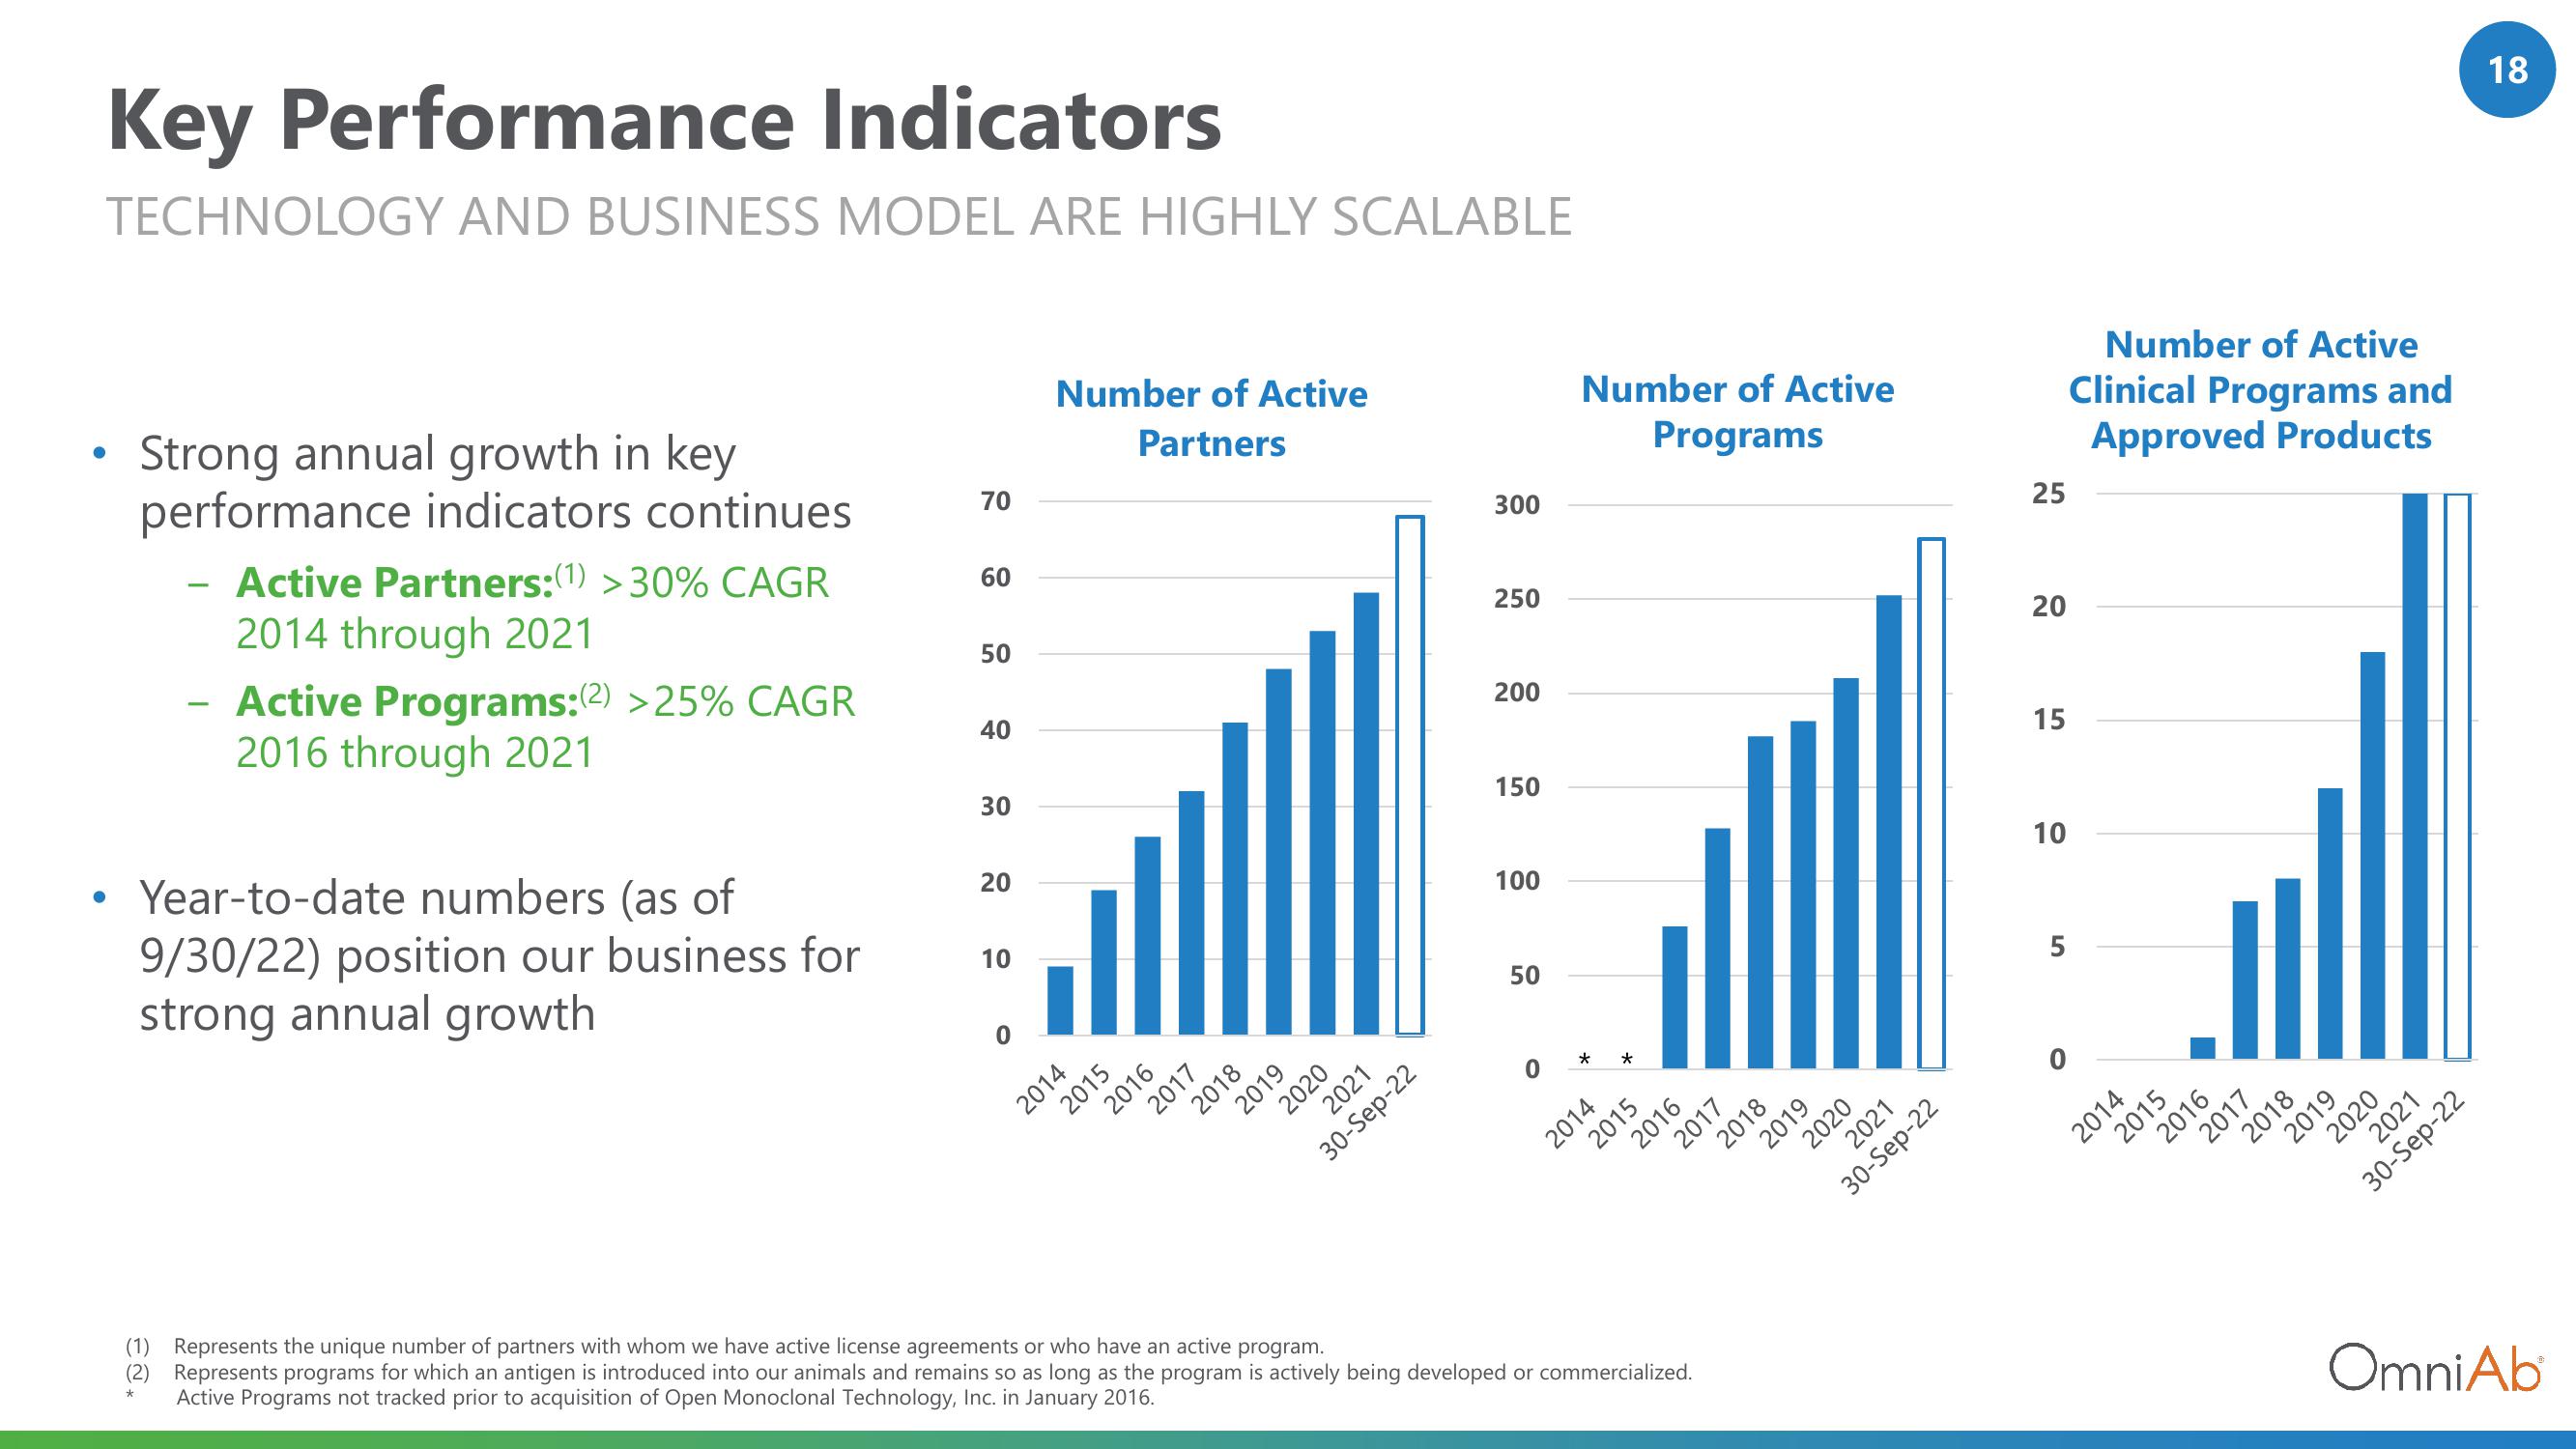
Strong annual growth in key
performance indicators continues
Active Partners:(1) >30% CAGR
2014 through 2021
Active Programs:(2) >25% CAGR
2016 through 2021
Year-to-date numbers (as of
9/30/22) position our business for
strong annual growth
70
60
50
40
30
20
10
0
Number of Active
Partners
2014
2015
2016
2017
2018
2019
2020
2021
30-Sep-22
300
250
200
150
100
50
0
Number of Active
Programs
* *
2014
2015
2016
2017
(1) Represents the unique number of partners with whom we have active license agreements or who have an active program.
(2) Represents programs for which an antigen is introduced into our animals and remains so as long as the program is actively being developed or commercialized.
Active Programs not tracked prior to acquisition of Open Monoclonal Technology, Inc. in January 2016.
*
2018
2019
2020
2021
30-Sep-22
25
20
15
10
5
Number of Active
Clinical Programs and
Approved Products
2014
2015
2016
2017
2018
2019
2020
2021
30-Sep-22
18
OmniAbView entire presentation