Pearson Results Presentation Deck
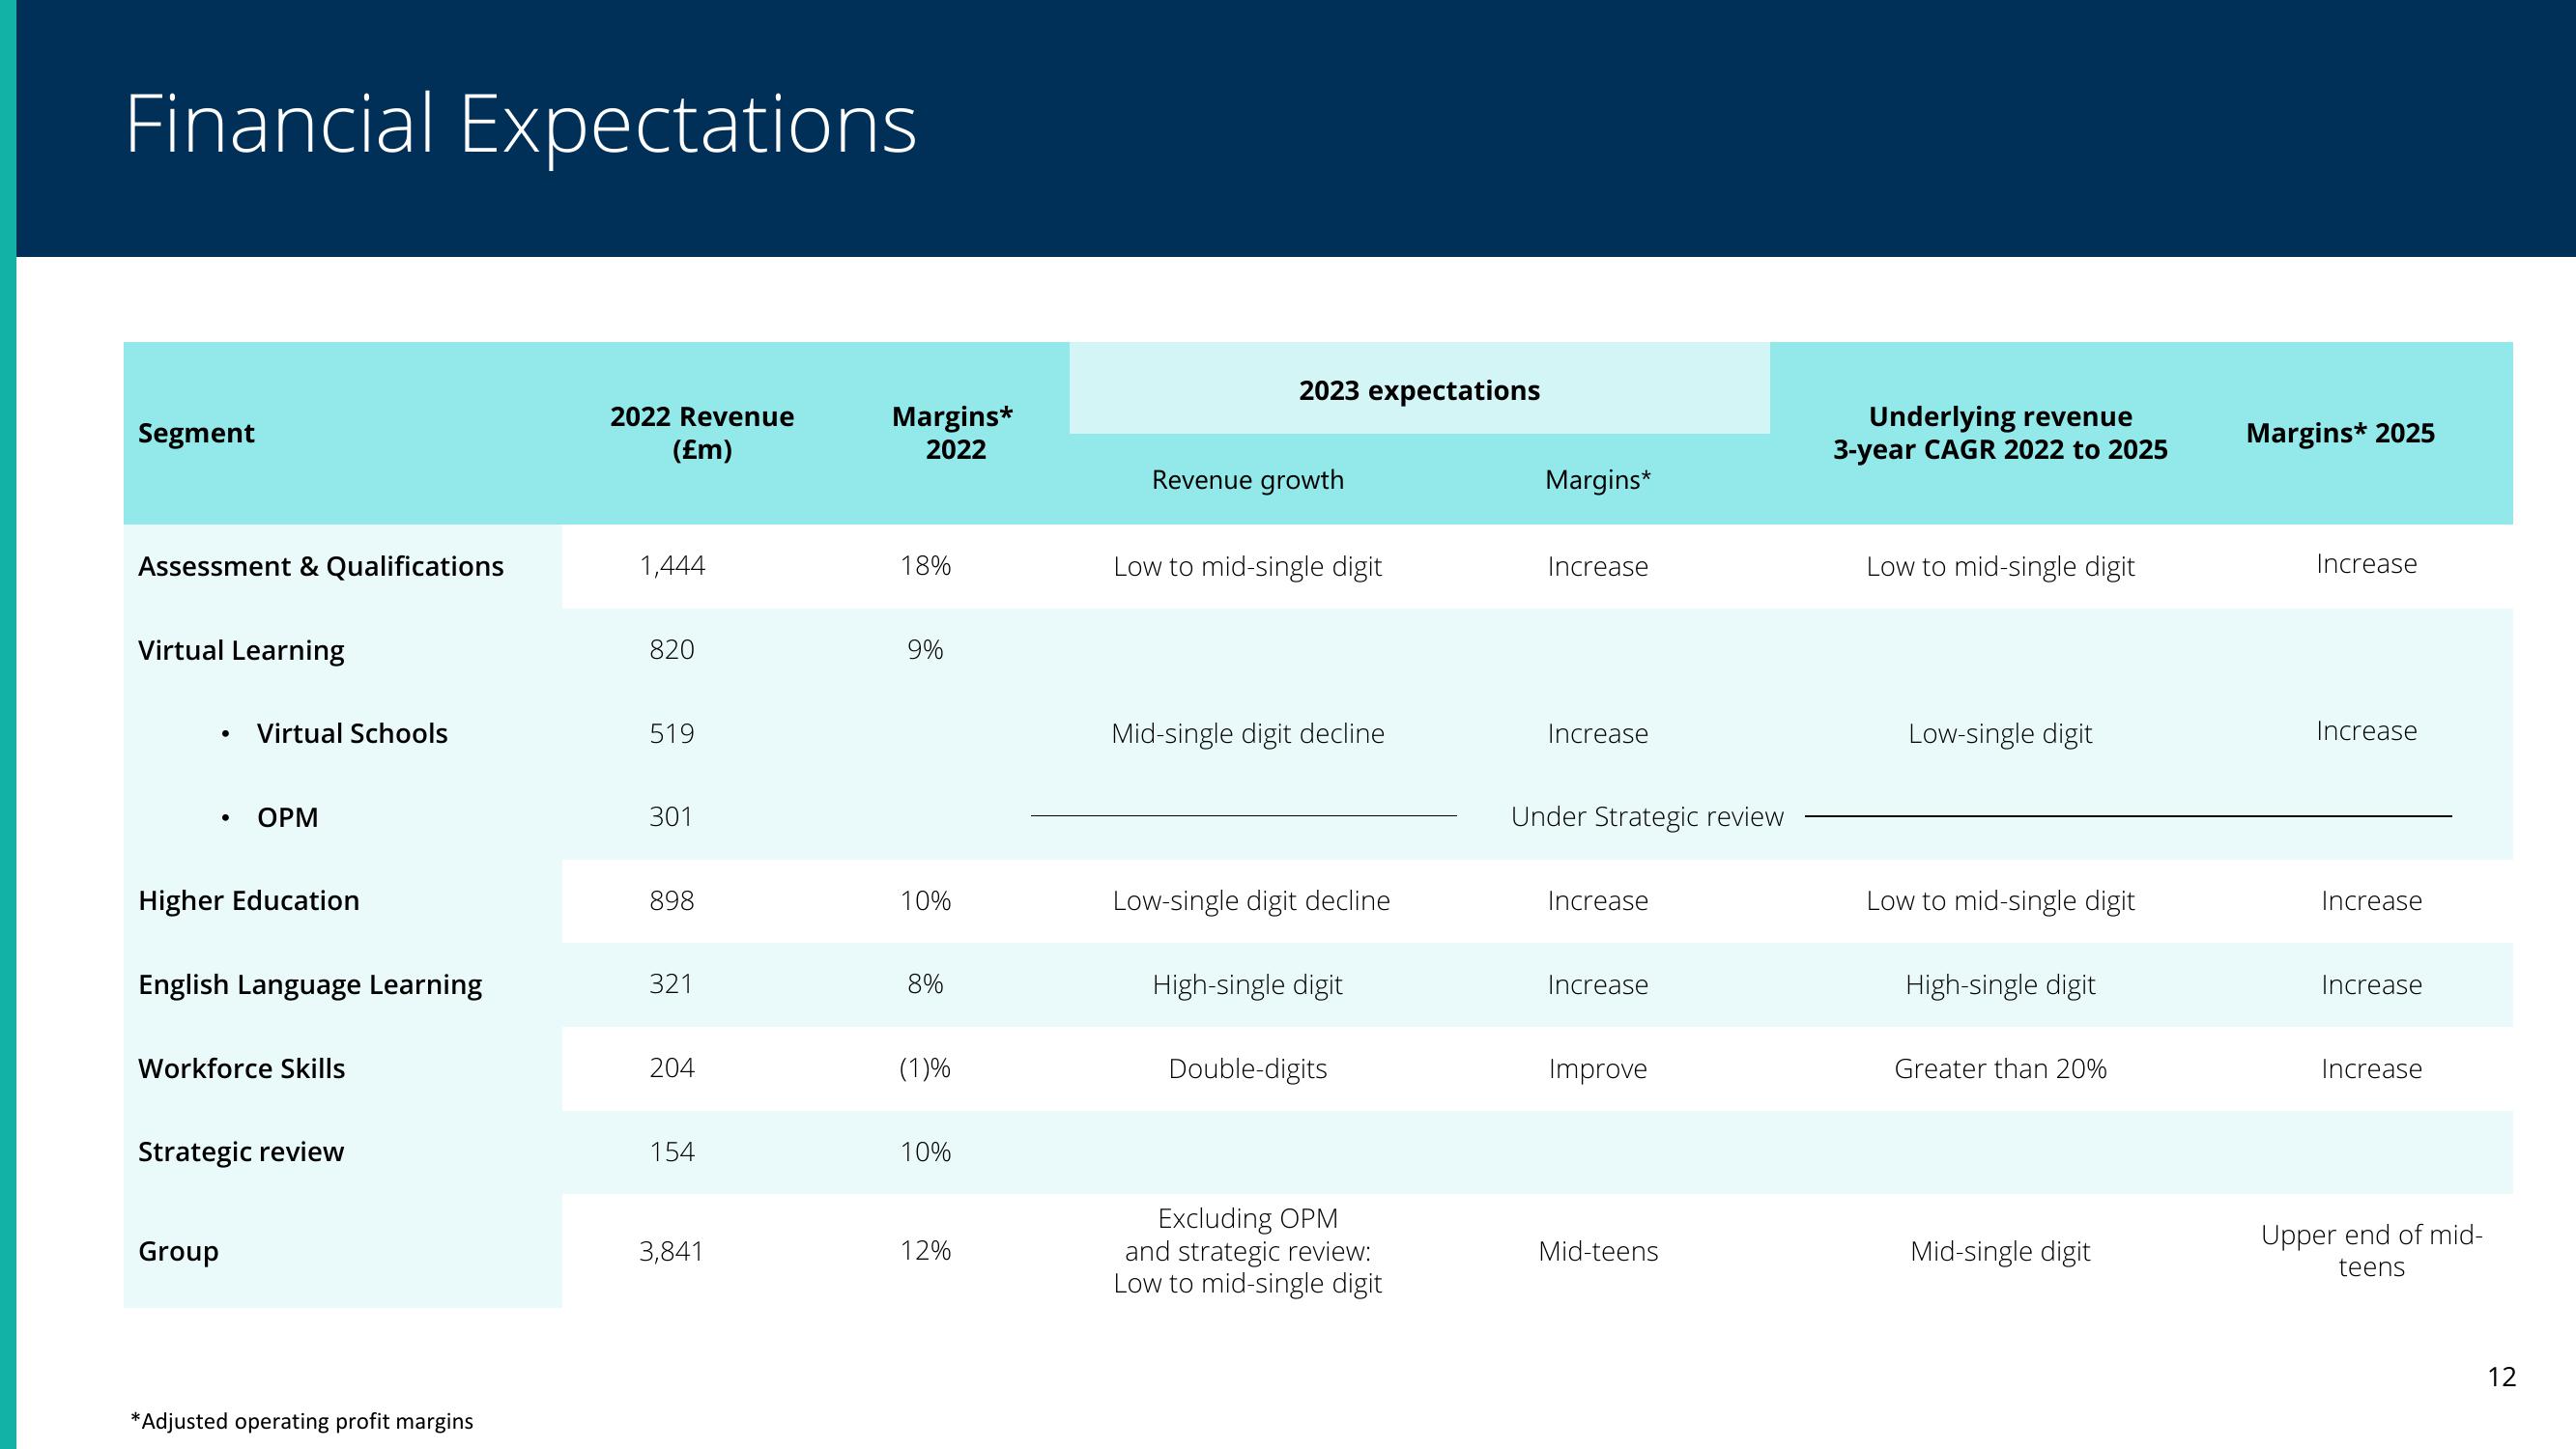
Financial Expectations
Segment
Assessment & Qualifications
Virtual Learning
.
●
Virtual Schools
OPM
Higher Education
Group
English Language Learning
Workforce Skills
Strategic review
*Adjusted operating profit margins
2022 Revenue
(£m)
1,444
820
519
301
898
321
204
154
3,841
Margins*
2022
18%
9%
10%
8%
(1)%
10%
12%
2023 expectations
Revenue growth
Low to mid-single digit
Mid-single digit decline
Low-single digit decline
High-single digit
Double-digits
Excluding OPM
and strategic review:
Low to mid-single digit
Margins*
Increase
Increase
Under Strategic review
Increase
Increase
Improve
Mid-teens
Underlying revenue
3-year CAGR 2022 to 2025
Low to mid-single digit
Low-single digit
Low to mid-single digit
High-single digit
Greater than 20%
Mid-single digit
Margins* 2025
Increase
Increase
Increase
Increase
Increase
Upper end of mid-
teens
12View entire presentation