Rippling Start Up Pitch Deck
Illustrative numbers shown, not actuals
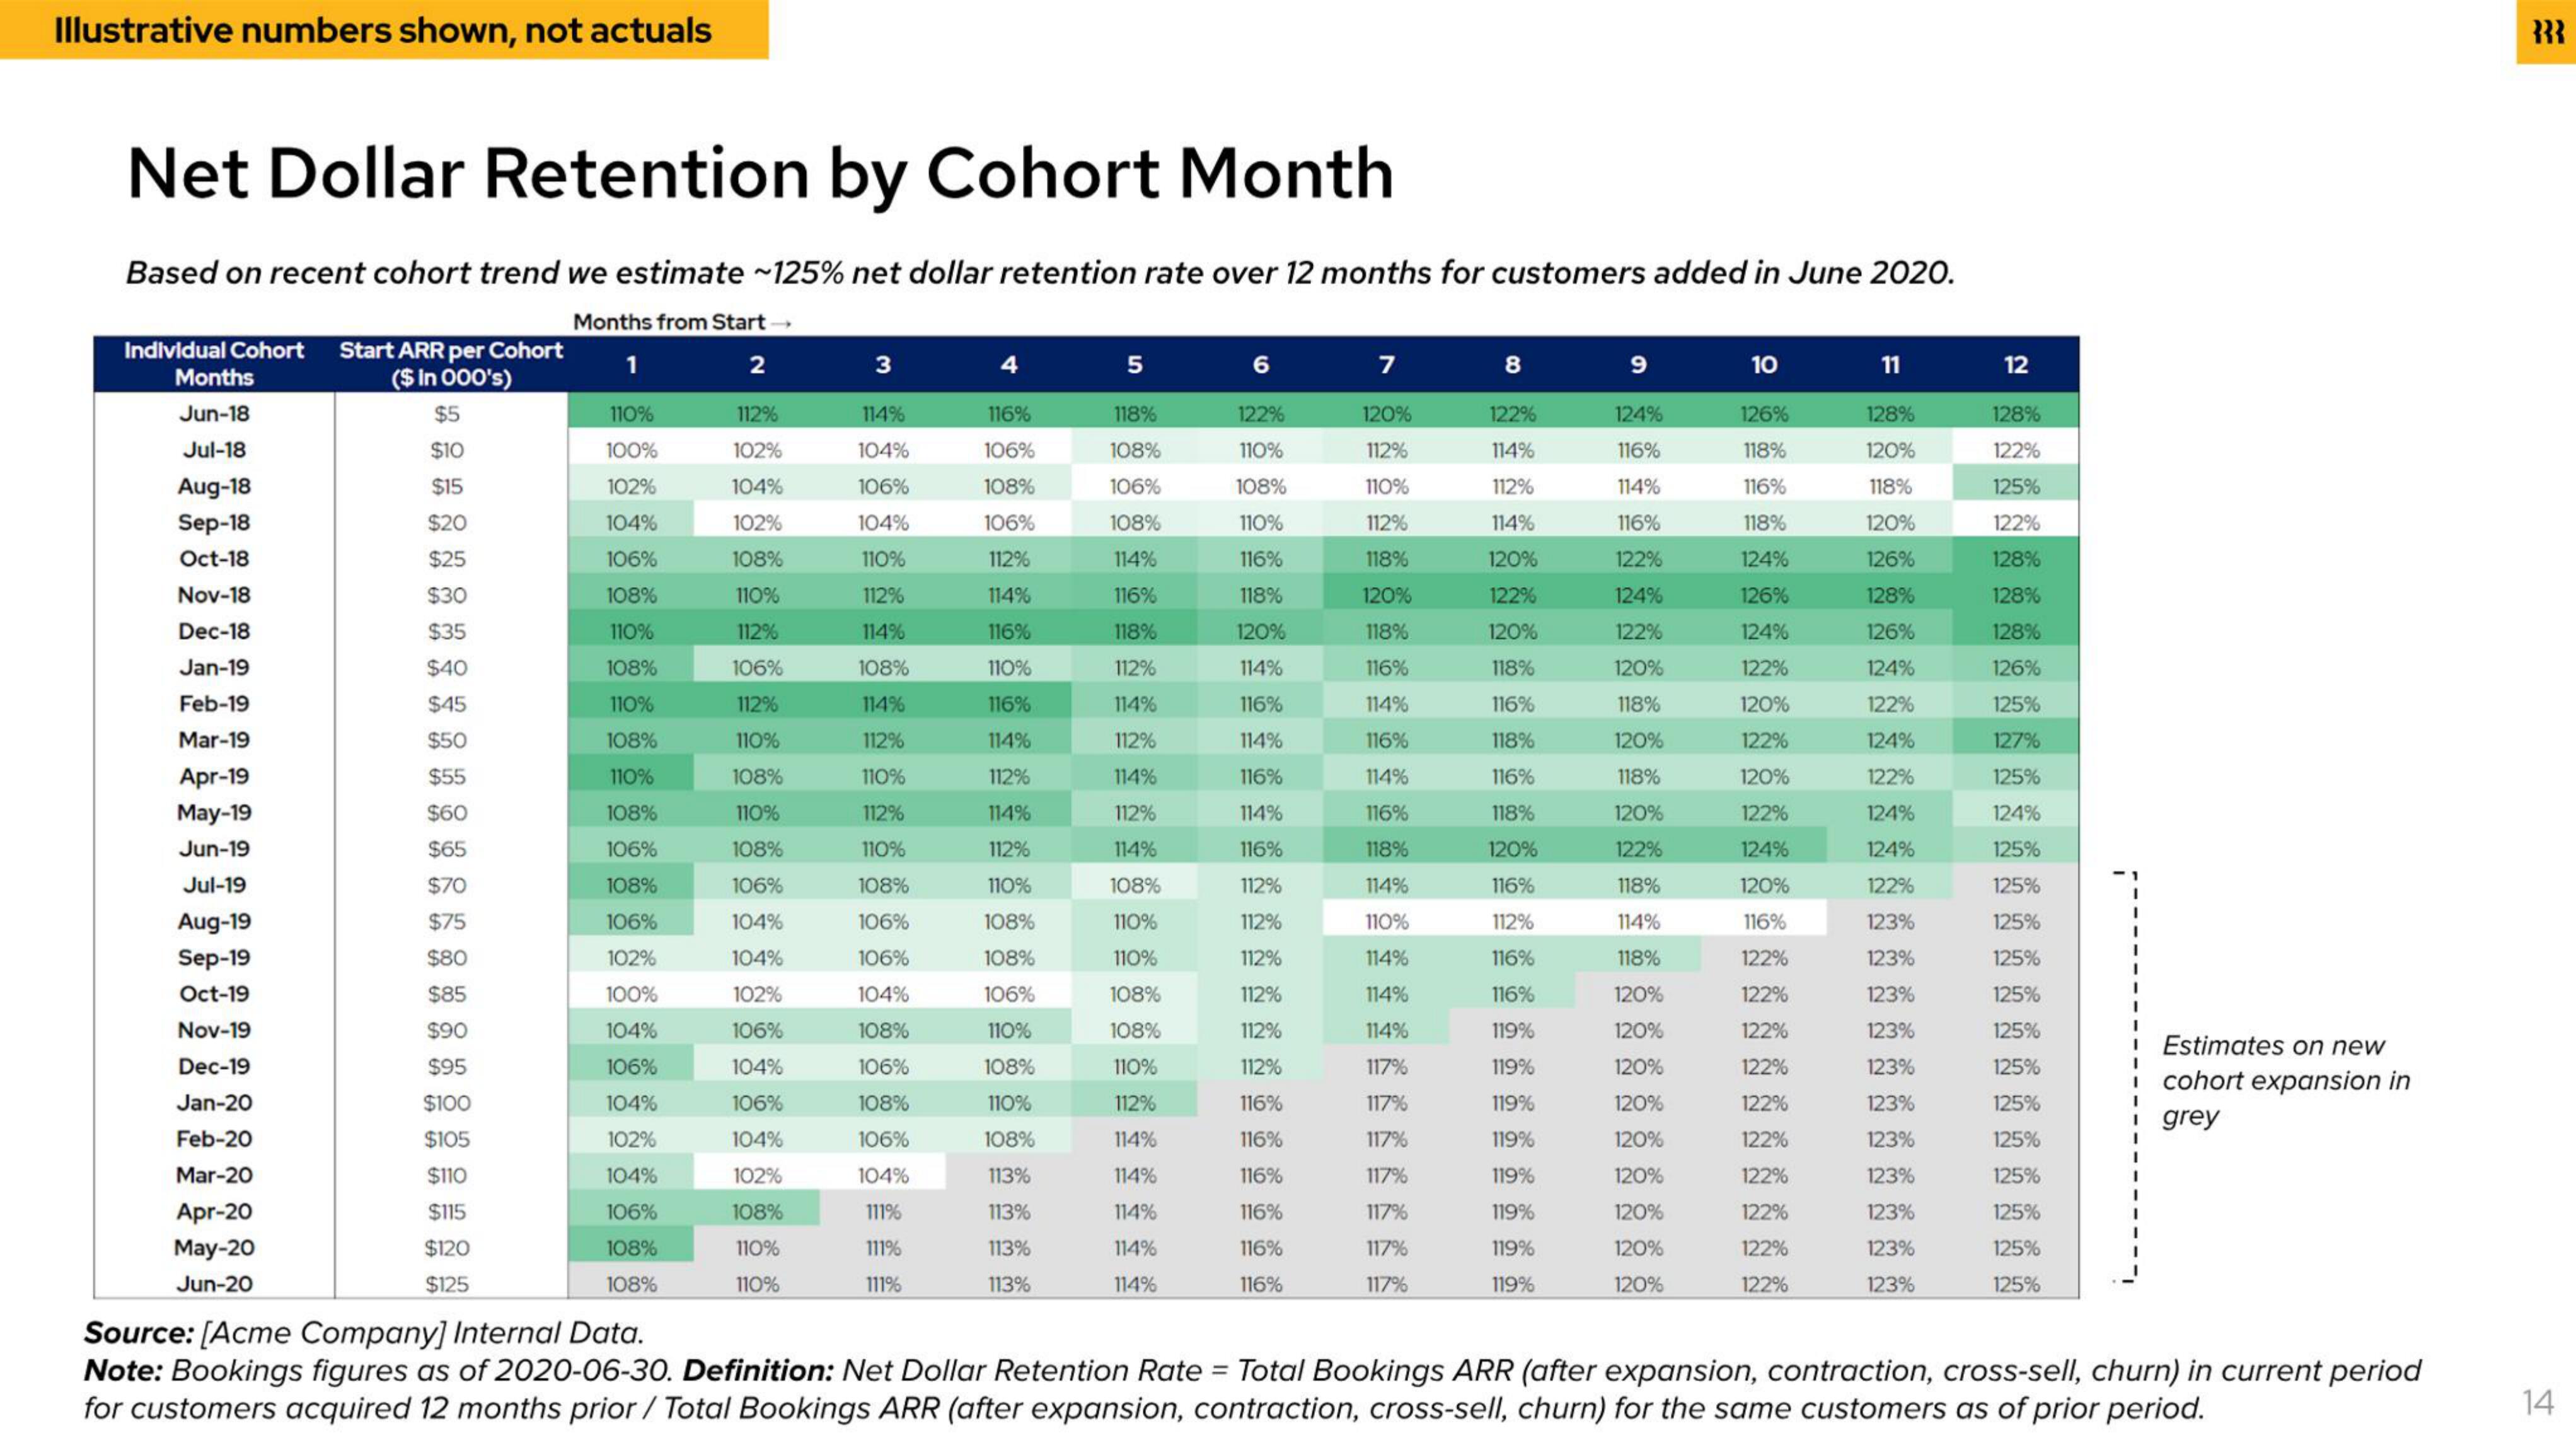
Net Dollar Retention by Cohort Month
Based on recent cohort trend we estimate ~125% net dollar retention rate over 12 months for customers added in June 2020.
Months from Start →
1
2
Individual Cohort Start ARR per Cohort
Months
($ in 000's)
Jun-18
$5
Jul-18
$10
Aug-18
$15
Sep-18
$20
Oct-18
$25
Nov-18
$30
Dec-18
$35
Jan-19
$40
Feb-19
$45
Mar-19
$50
Apr-19
$55
May-19
$60
Jun-19
$65
Jul-19
$70
Aug-19
$75
Sep-19
$80
Oct-19
$85
Nov-19
$90
Dec-19
$95
Jan-20
$100
Feb-20
$105
Mar-20
$110
$115
Apr-20
May-20
$120
Jun-20
$125
110%
100%
102%
104%
106%
108%
110%
108%
110%
108%
110%
108%
106%
108%
106%
102%
100%
104%
106%
104%
102%
104%
106%
108%
108%
112%
102%
104%
102%
108%
110
112%
106%
112%
110%
108%
110%
108%
106%
104%
104%
102%
106%
104%
106%
104%
102%
108%
110%
110%
3
114%
104%
106%
104%
110%
112%
114%
108%
114%
112%
110%
112%
110%
108%
106%
106%
104%
108%
106%
108%
106%
104%
111%
111%
111%
4
116%
106%
108%
106%
112%
114%
116%
110%
116%
114%
112%
114%
112%
110%
108%
108%
106%
110%
108%
110%
108%
113%
113%
113%
113%
5
118%
108%
106%
108%
114%
116%
118%
112%
114%
112%
114%
112%
114%
108%
110%
110%
108%
108%
110%
112%
114%
114%
114%
114%
114%
6
122%
110%
108%
110%
116%
120%
114%
116%
114%
116%
114%
116%
112%
112%
112%
112%
112%
112%
116%
116%
116%
116%
116%
116%
7
120%
112%
110%
112%
118%
120%
118%
116%
114%
116%
114%
116%
118%
114%
110%
114%
114%
114%
117%
117%
117%
117%
117%
117%
117%
8
122%
114%
112%
114%
120%
122%
120%
118%
116%
118%
116%
118%
120%
116%
112%
116%
116%
119%
119%
119%
119%
119%
119%
119%
119%
9
124%
116%
114%
116%
122%
124%
122%
120%
118%
120%
118%
120%
122%
118%
114%
118%
120%
120%
120%
120%
120%
120%
120%
120%
120%
10
126%
118%
116%
118%
124%
126%
124%
122%
120%
122%
120%
122%
124%
120%
116%
122%
122%
122%
122%
122%
122%
122%
122%
122%
122%
11
128%
120%
118%
120%
126%
128%
126%
124%
122%
124%
122%
124%
124%
122%
123%
123%
123%
123%
123%
123%
123%
123%
123%
123%
123%
12
128%
122%
125%
122%
128%
128%
128%
126%
125%
127%
125%
124%
125%
125%
125%
125%
125%
125%
125%
125%
125%
125%
125%
125%
125%
Estimates on new
i cohort expansion in
grey
I
Source: [Acme Company] Internal Data.
Note: Bookings figures as of 2020-06-30. Definition: Net Dollar Retention Rate = Total Bookings ARR (after expansion, contraction, cross-sell, churn) in current period
for customers acquired 12 months prior / Total Bookings ARR (after expansion, contraction, cross-sell, churn) for the same customers as of prior period.
333
14View entire presentation