J.P.Morgan Investment Banking Pitch Book
APPENDIX
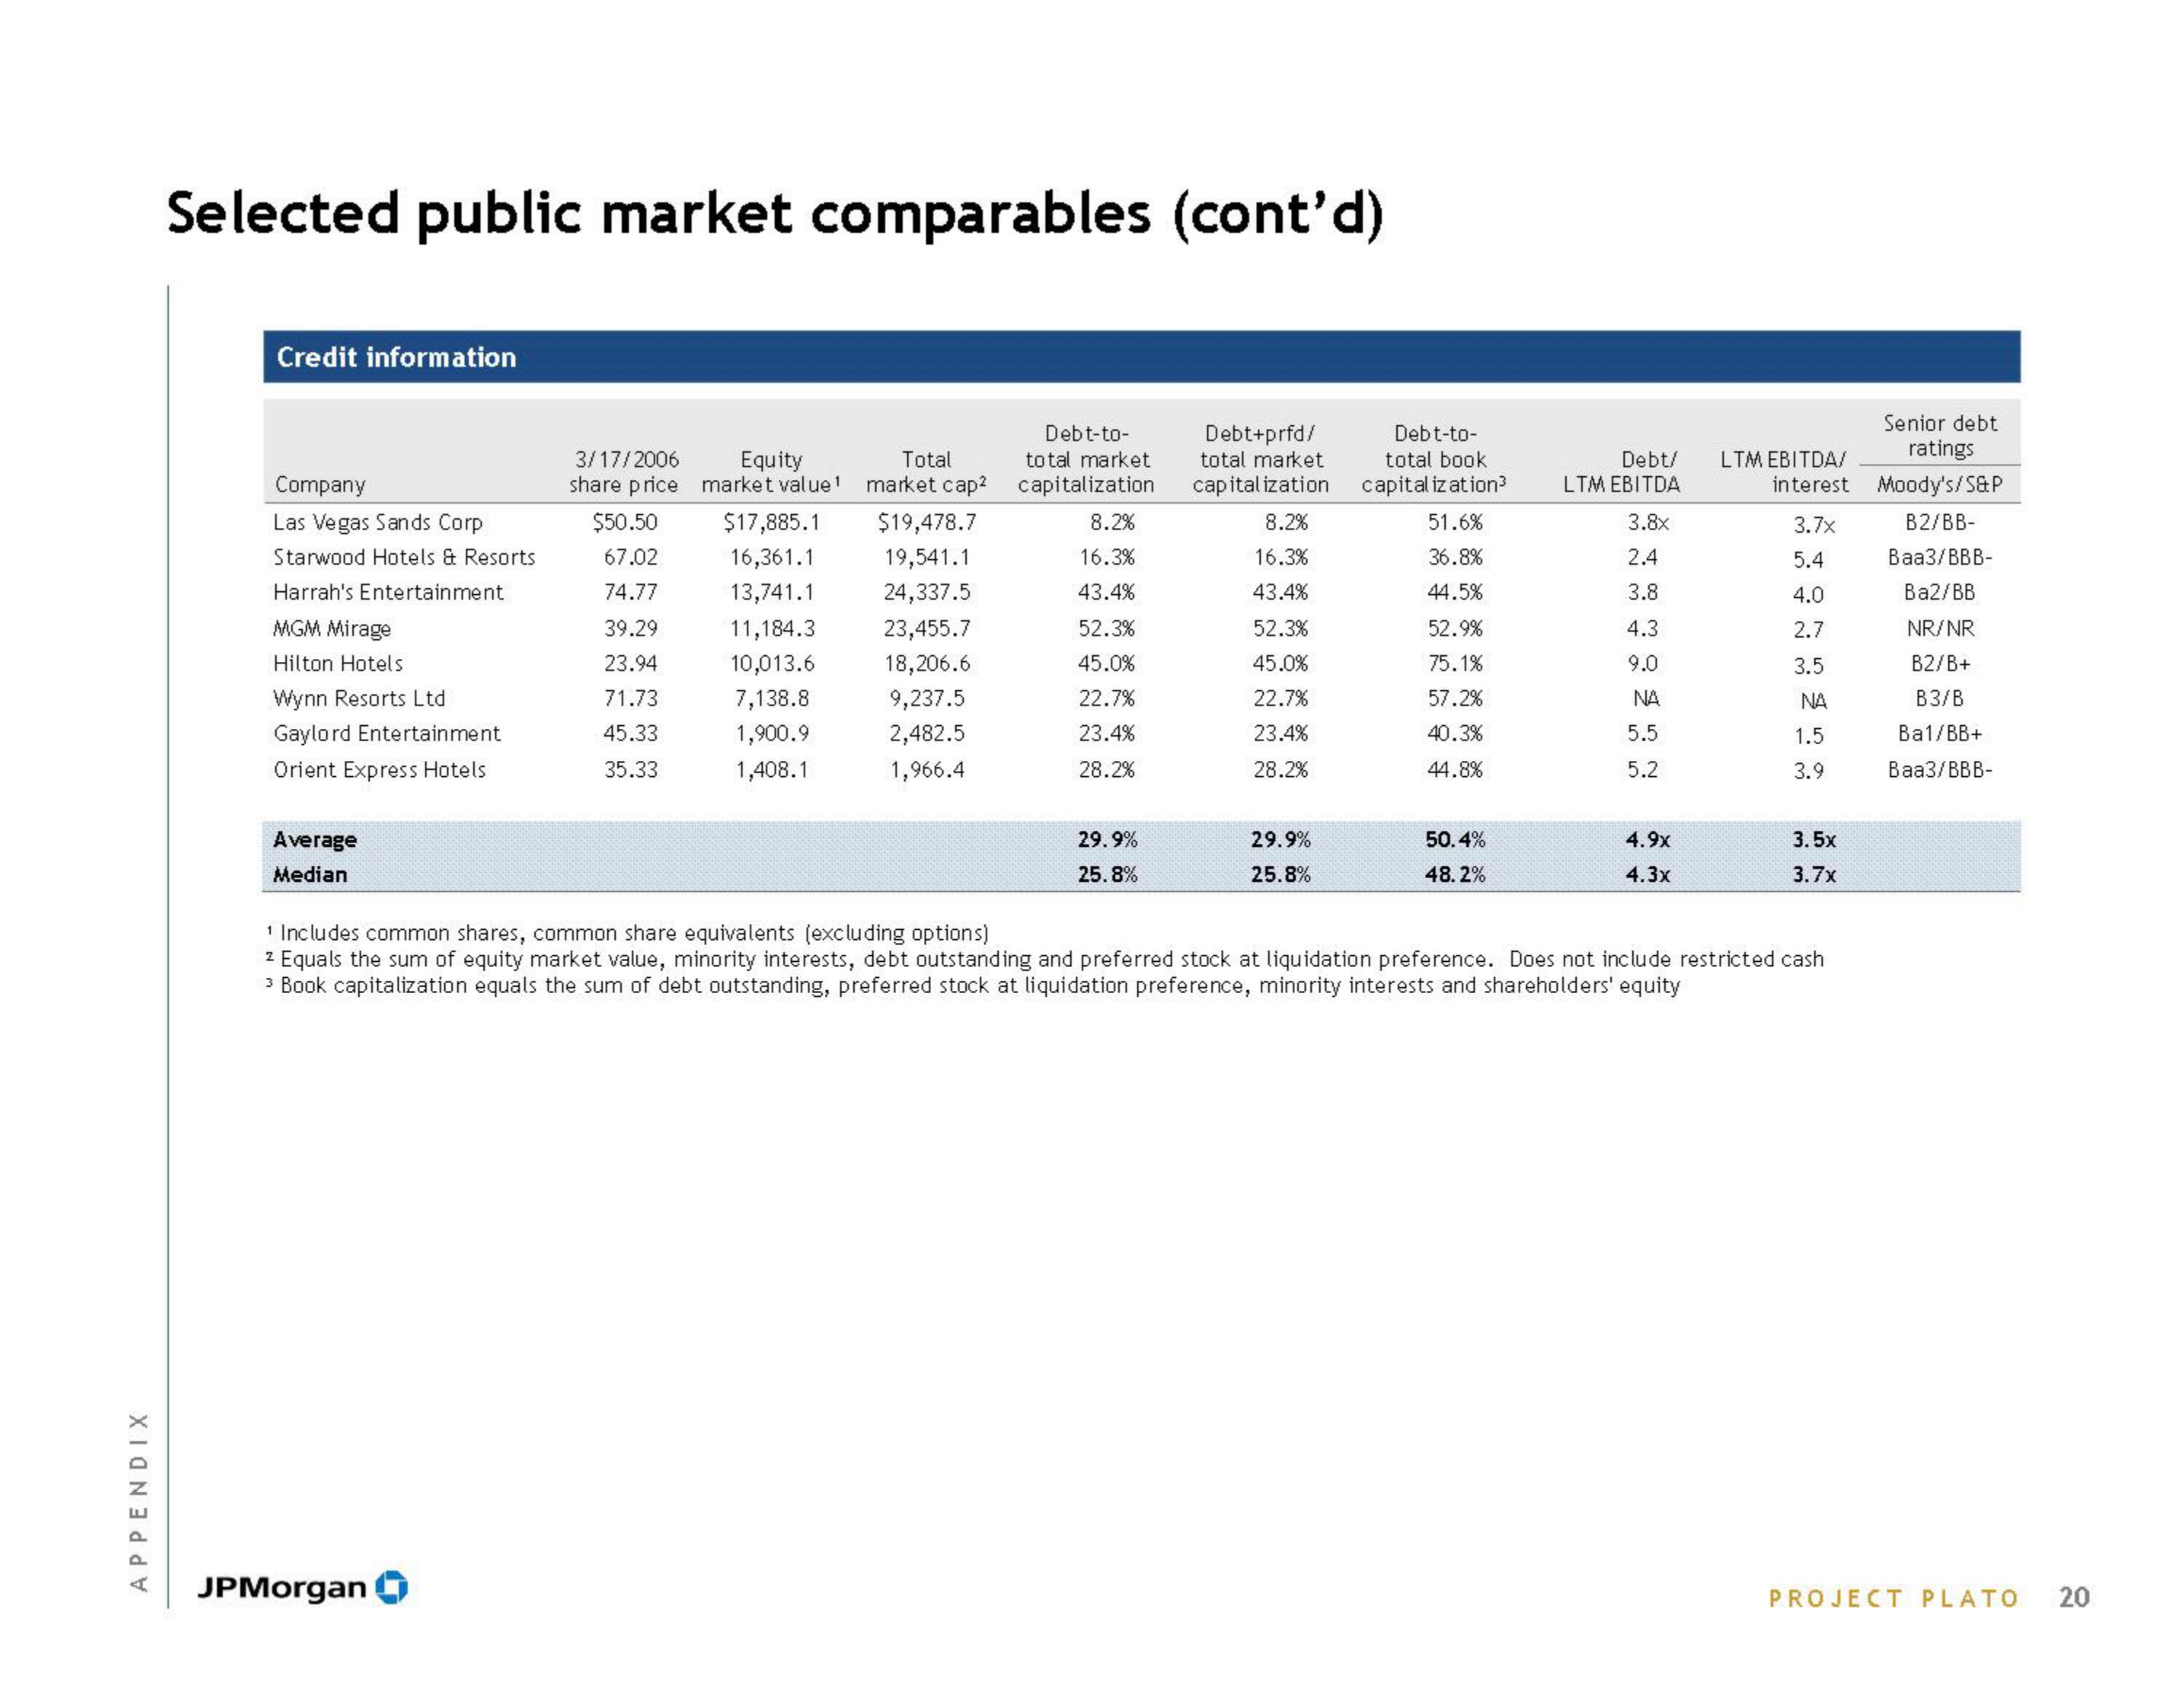
Selected public market comparables (cont'd)
Credit information
Company
Las Vegas Sands Corp
Starwood Hotels & Resorts
Harrah's Entertainment
MGM Mirage
Hilton Hotels
Wynn Resorts Ltd
Gaylord Entertainment
Orient Express Hotels
Average
Median
3/17/2006
share price
JPMorgan
$50.50
67.02
74.77
39.29
23.94
71.73
45.33
35.33
Equity
market value¹
$17,885.1
16,361.1
13,741.1
11,184.3
10,013.6
7,138.8
1,900.9
1,408.1
Debt-to-
Total
total market
market cap² capitalization
$19,478.7
19,541.1
24,337.5
23,455.7
18,206.6
9,237.5
2,482.5
1,966.4
8.2%
16.3%
43.4%
52.3%
45.0%
22.7%
23.4%
28.2%
29.9%
25.8%
Debt+prfd/
total market
capitalization
8.2%
16.3%
43.4%
52.3%
45.0%
22.7%
23.4%
28.2%
29.9%
25.8%
Debt-to-
total book
capitalization³
51.6%
36.8%
44.5%
52.9%
75.1%
57.2%
40.3%
44.8%
50.4%
48.2%
Debt/
LTM EBITDA
3.8x
2.4
3.8
4.3
9.0
NA
5.5
5.2
4.9x
4.3x
LTM EBITDA/
interest
3.7x
5.4
4.0
2.7
3.5
NA
1.5
3.9
3.5x
3.7x
¹ Includes common shares, common share equivalents (excluding options)
z Equals the sum of equity market value, minority interests, debt outstanding and preferred stock at liquidation preference. Does not include restricted cash
3 Book capitalization equals the sum of debt outstanding, preferred stock at liquidation preference, minority interests and shareholders' equity
Senior debt
ratings
Moody's/S&P
B2/BB-
Baa3/BBB-
Ba2/BB
NR/NR
B2/B+
B3/B
Ba1/BB+
Baa3/BBB-
PROJECT PLATO 20View entire presentation