Hostess Investor Presentation Deck
H₁
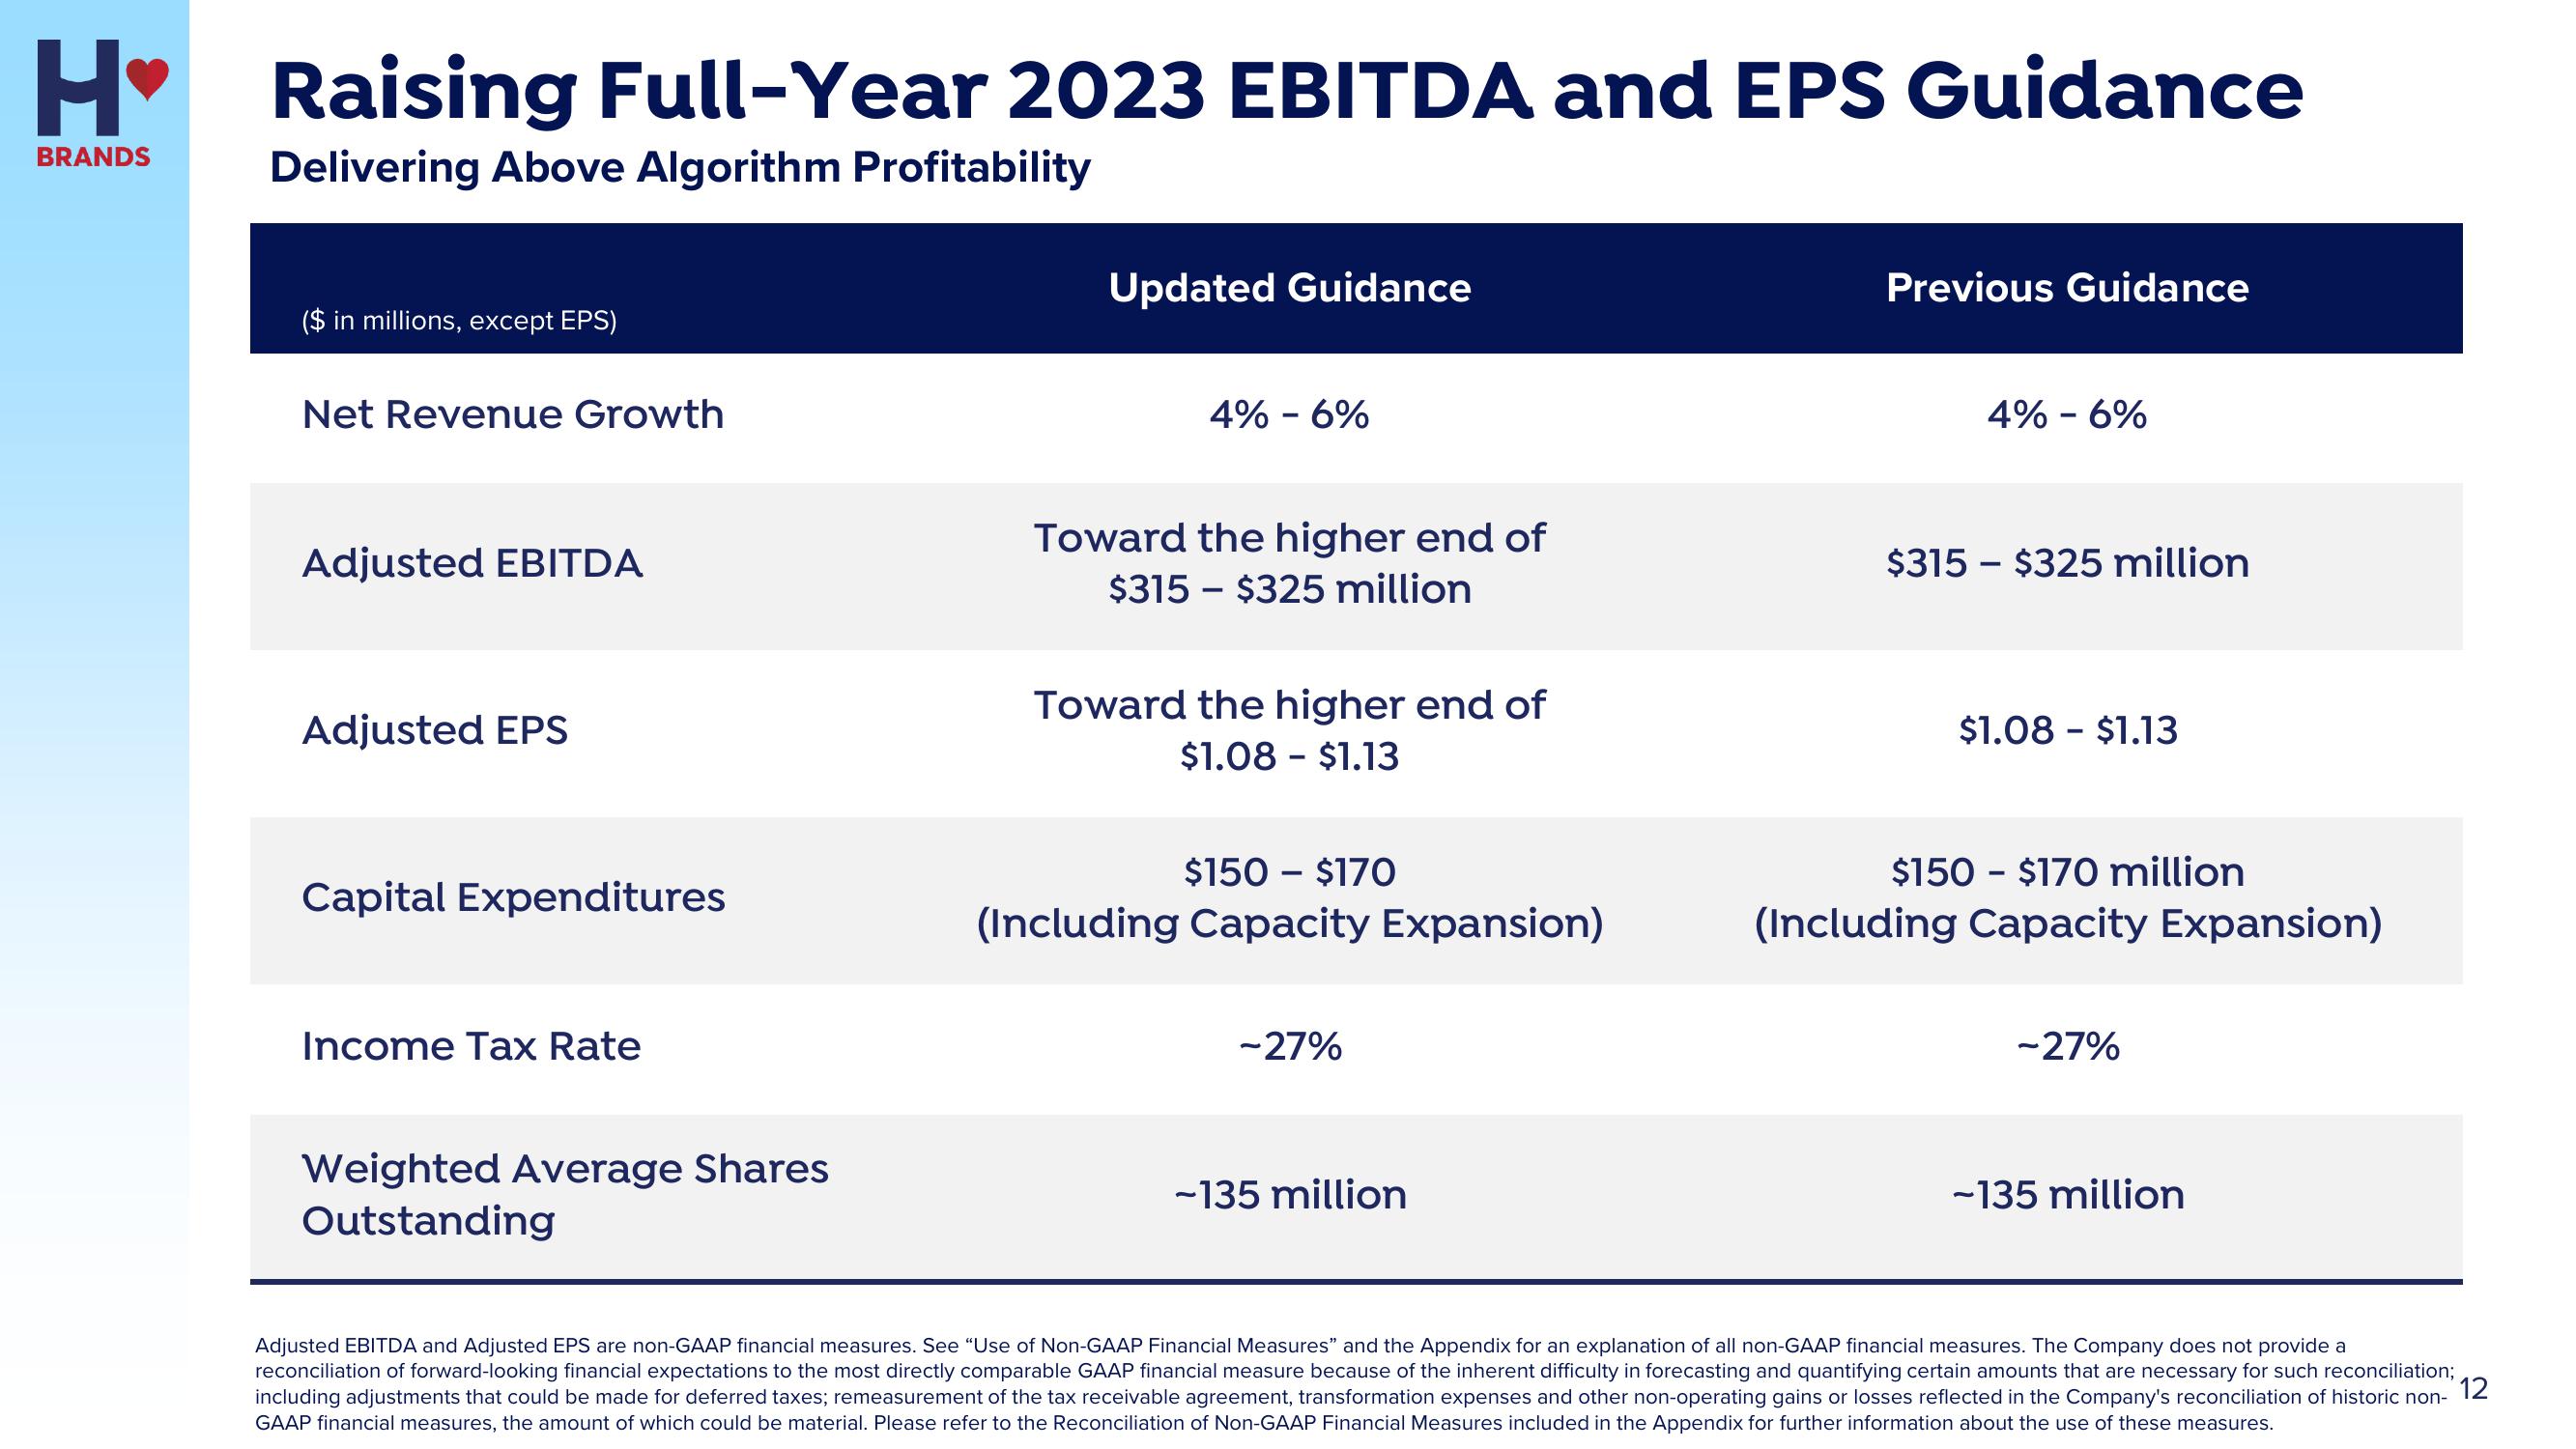
H❤ Raising Full-Year 2023 EBITDA and EPS Guidance
BRANDS
Delivering Above Algorithm Profitability
($ in millions, except EPS)
Net Revenue Growth
Adjusted EBITDA
Adjusted EPS
Capital Expenditures
Income Tax Rate
Weighted Average Shares
Outstanding
Updated Guidance
4% -6%
Toward the higher end of
$315 $325 million
Toward the higher end of
$1.08 - $1.13
$150 - $170
(Including Capacity Expansion)
-27%
-135 million
Previous Guidance
4% -6%
$315 - $325 million
$1.08 - $1.13
$150 - $170 million
(Including Capacity Expansion)
-27%
-135 million
Adjusted EBITDA and Adjusted EPS are non-GAAP financial measures. See "Use of Non-GAAP Financial Measures" and the Appendix for an explanation of all non-GAAP financial measures. The Company does not provide a
reconciliation of forward-looking financial expectations to the most directly comparable GAAP financial measure because of the inherent difficulty in forecasting and quantifying certain amounts that are necessary for such reconciliation;
including adjustments that could be made for deferred taxes; remeasurement of the tax receivable agreement, transformation expenses and other non-operating gains or losses reflected in the Company's reconciliation of historic non- 12
GAAP financial measures, the amount of which could be material. Please refer to the Reconciliation of Non-GAAP Financial Measures included in the Appendix for further information about the use of these measures.View entire presentation