GMS Results Presentation Deck
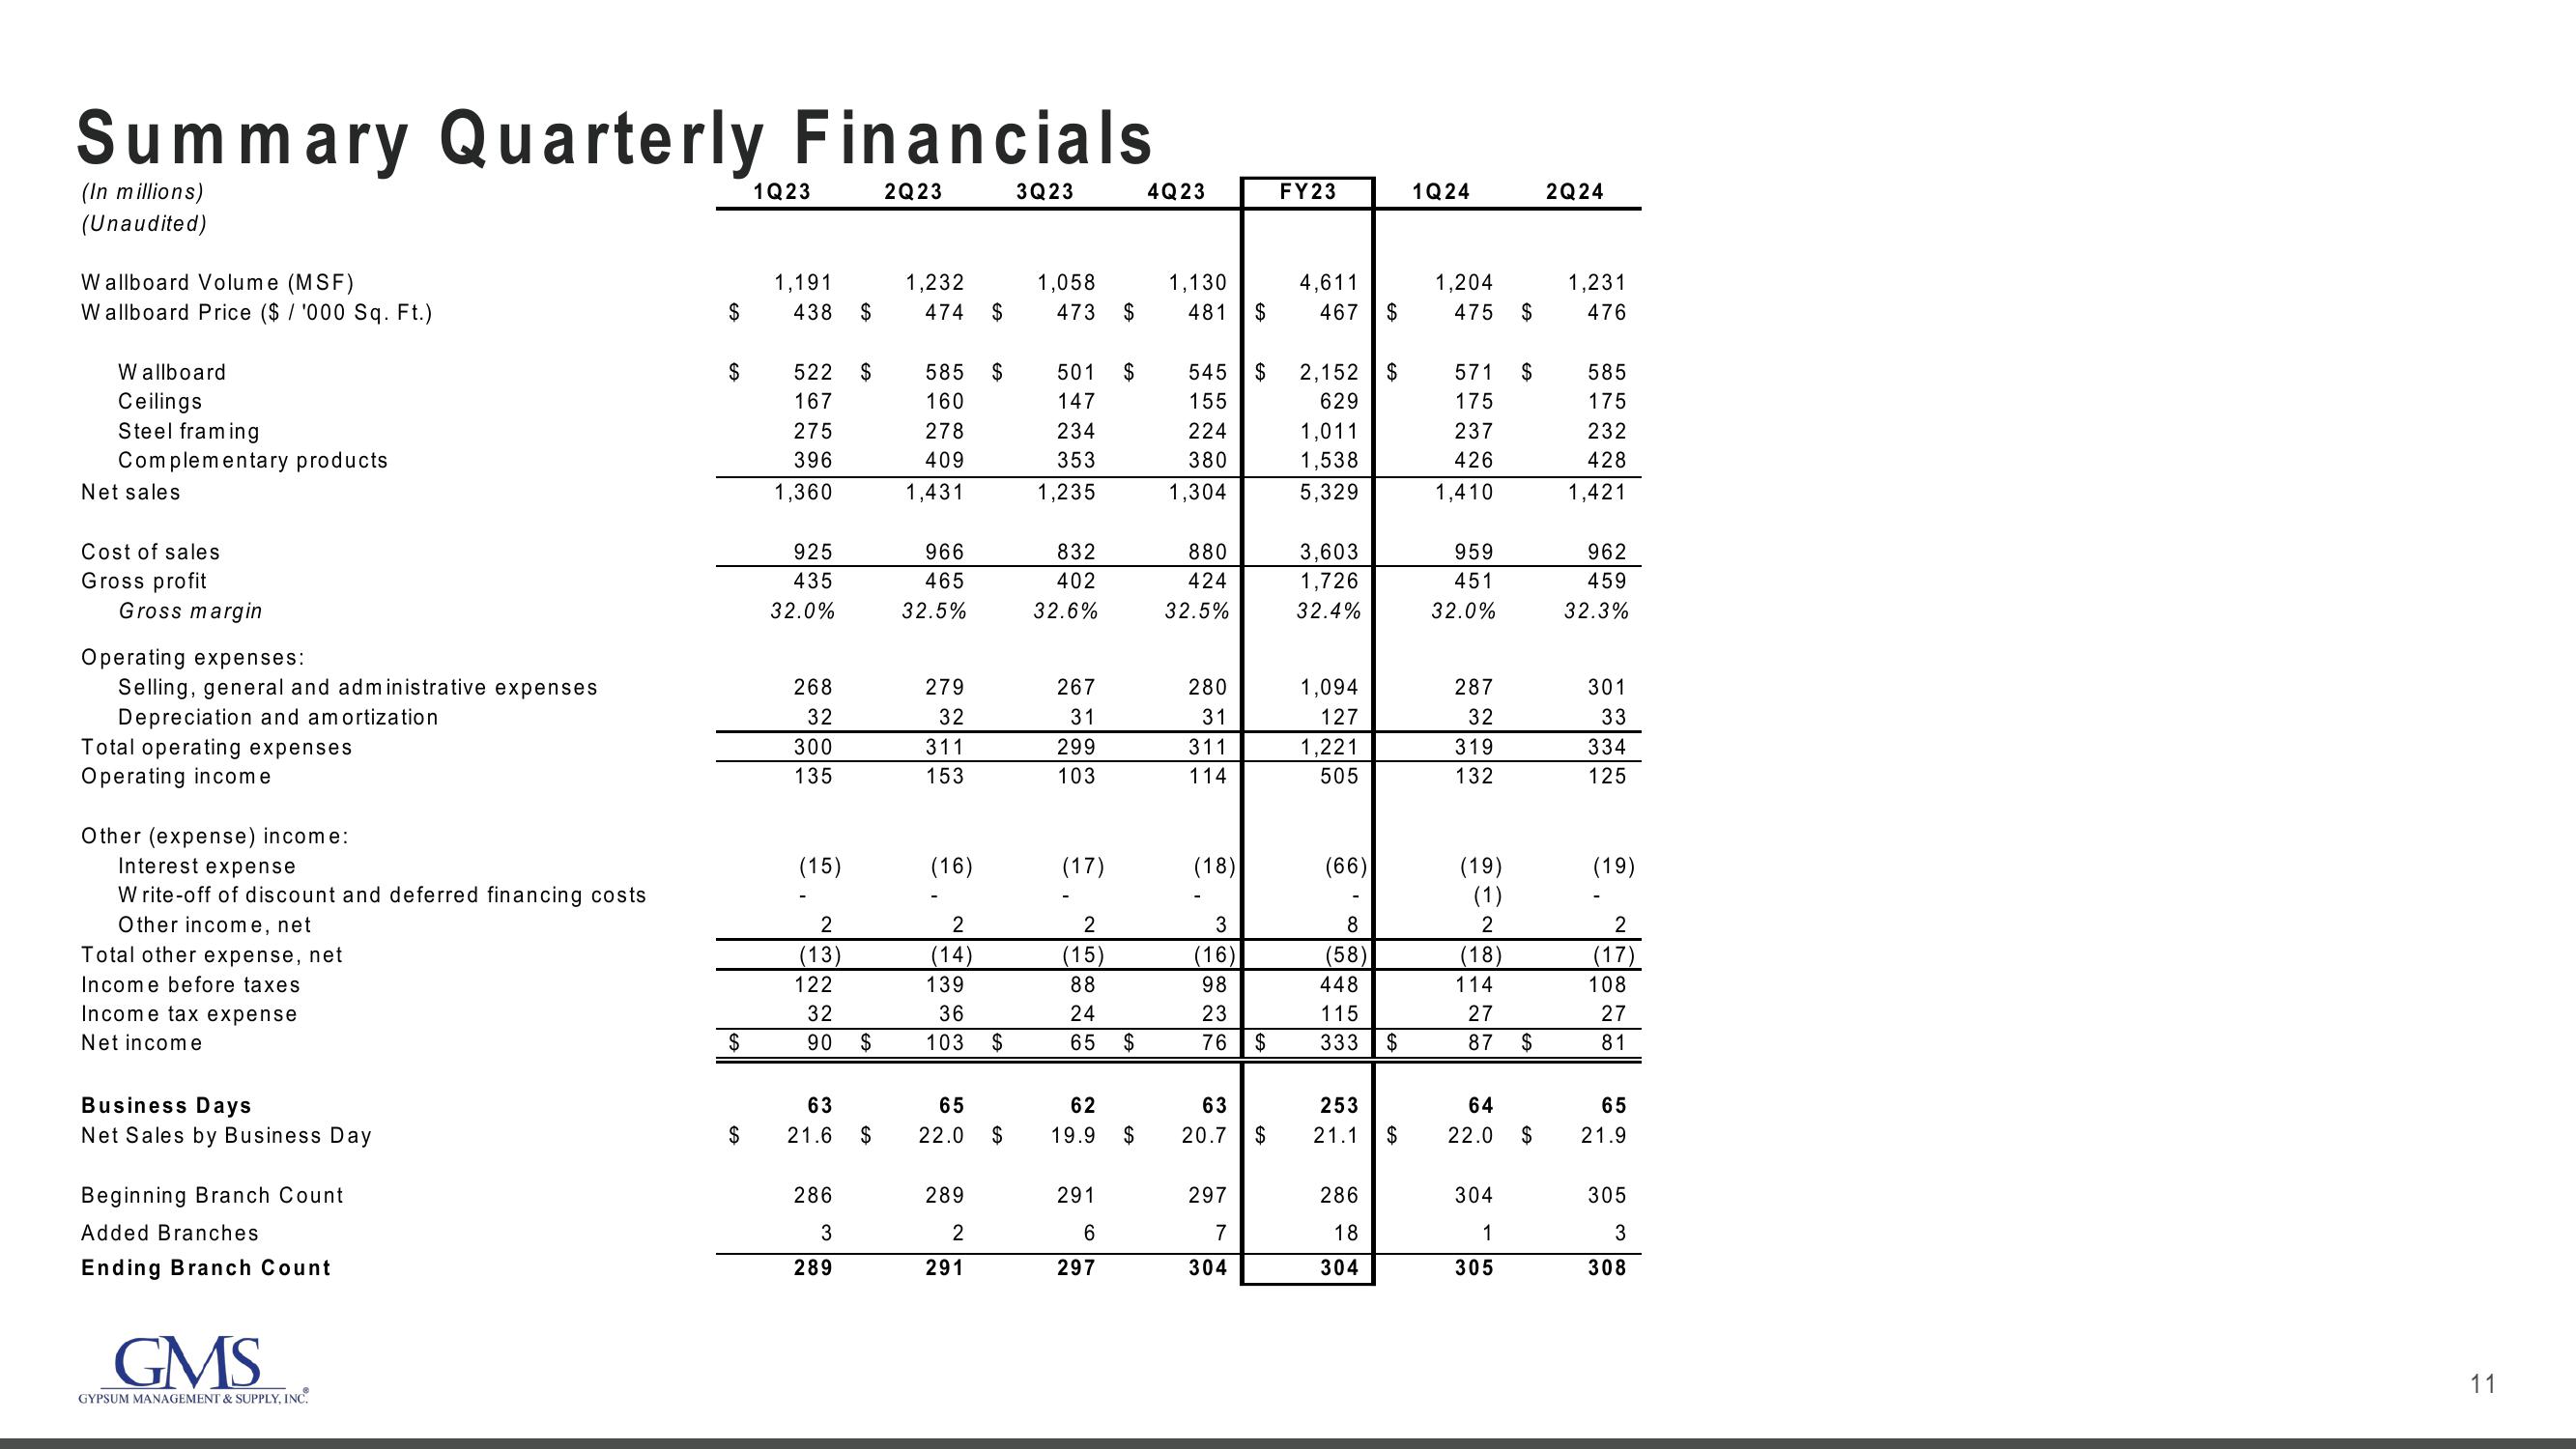
Summary Quarterly Financials
(In millions)
(Unaudited)
Wallboard Volume (MSF)
Wallboard Price ($ /'000 Sq. Ft.)
Wallboard
Ceilings
Steel framing
Complementary products
Net sales
Cost of sales
Gross profit
Gross margin
Operating expenses:
Selling, general and administrative expenses
Depreciation and amortization
Total operating expenses
Operating income
Other (expense) income:
Interest expense
Write-off of discount and deferred financing costs
Other income, net
Total other expense, net
Income before taxes
Income tax expense
Net income
Business Days
Net Sales by Business Day
Beginning Branch Count
Added Branches
Ending Branch Count
GMS
GYPSUM MANAGEMENT & SUPPLY, INC.
$
$
$
$
1Q23
1,191
438 $
522 $
167
275
396
1,360
925
435
32.0%
268
32
300
135
(15)
2
(13)
122
32
90
$
63
21.6 $
286
3
289
2Q23
1,232
474 $
585
160
278
409
1,431
966
465
32.5%
279
32
311
153
(16)
2
(14)
139
36
103 $
65
22.0
289
2
291
$
3Q23
1,058
473 $
501
147
234
353
1,235
832
402
32.6%
267
31
299
103
(17)
2
(15)
88
-826
24
65
62
19.9
291
6
297
$
$
$
4Q23
1,130
481 $
545 $
155
224
380
1,304
880
424
32.5%
280
31
311
114
(18)
3
(16)
98
23
76 $
63
20.7
297
7
304
$
FY23
4,611
467 $
2,152
629
1,011
1,538
5,329
3,603
1,726
32.4%
1,094
127
1,221
505
(66)
8
(58)
$
448
115
333 $
253
21.1 $
286
18
304
1Q24
1,204
475 $
571
175
237
426
1,410
959
451
32.0%
287
32
319
132
(19)
(1)
2
(18)
114
27
87
$
64
22.0 $
304
1
305
2Q24
1,231
476
585
175
232
428
1,421
962
459
32.3%
301
33
334
125
(19)
2
(17)
108
27
81
65
21.9
305
3
308
11View entire presentation