Vertical Aerospace SPAC Presentation Deck
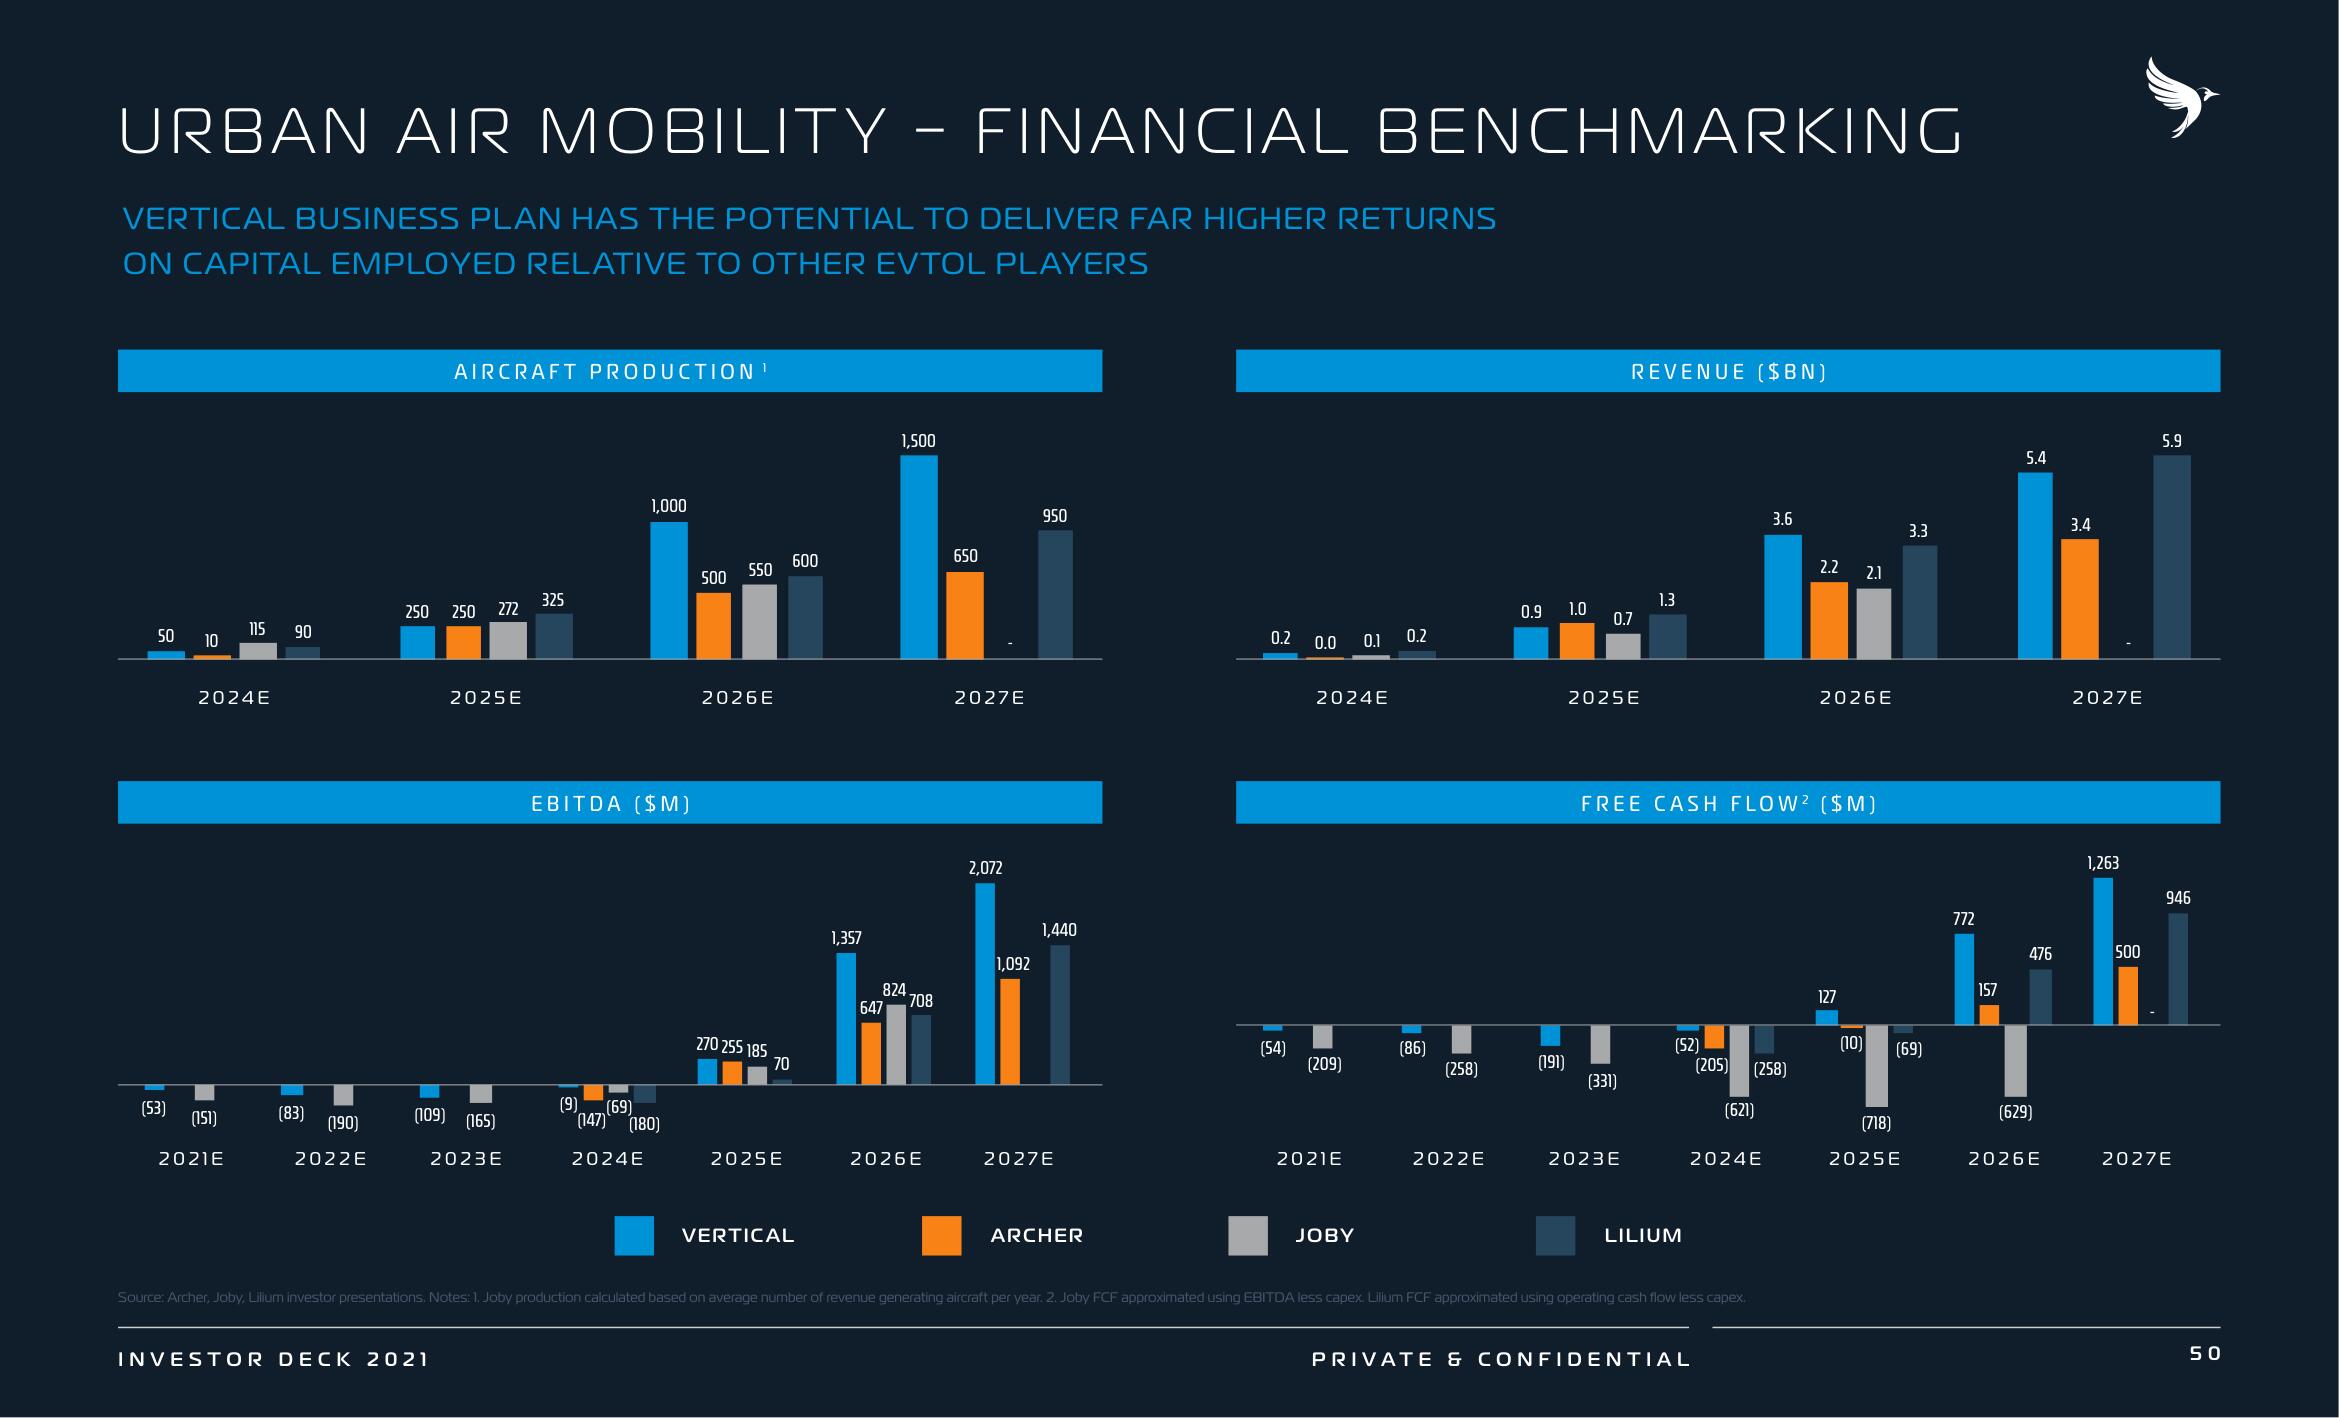
URBAN AIR MOBILITY - FINANCIAL BENCHMARKING
VERTICAL BUSINESS PLAN HAS THE POTENTIAL TO DELIVER FAR HIGHER RETURNS
ON CAPITAL EMPLOYED RELATIVE TO OTHER EVTOL PLAYERS
50
(53)
10
2024E
(151)
115
2021E
90
(83)
(190)
2022E
AIRCRAFT PRODUCTION ¹
250 250 272
2025E
(109) (165)
2023E
INVESTOR DECK 2021
325
1,000
EBITDA ($M)
(9)
(69)
(147) (180)
2024E
500
550
2026E
270 255 185
70
2025E
600
VERTICAL
1,357
1,500
824
708
647
2026E
650
2027E
2,072
1,092
950
1,440
2027E
ARCHER
0.2 0.0
(54)
2024E
(209)
2021E
0.1
JOBY
0.2
(86)
(258)
2022E
0.9 1.0
(191)
0.7
REVENUE ($BN)
2025E
(331)
2023E
1.3
FREE CASH FLOW2 ($M)
(52)
(205)
LILIUM
Source: Archer, Joby, Lilium investor presentations. Notes: 1. Joby production calculated based on average number of revenue generating aircraft per year. 2. Joby FCF approximated using EBITDA less capex. Lillum FCF approximated using operating cash flow less capex.
(621)
2024E
PRIVATE & CONFIDENTIAL
3.6
(258)
2.2 2.1
2026E
127
(10)
3.3
(69)
(718)
2025E
772
157
5.4
476
(629)
2026E
3.4
2027E
1,263
500
5.9
946
2027E
50View entire presentation