Sonos Results Presentation Deck
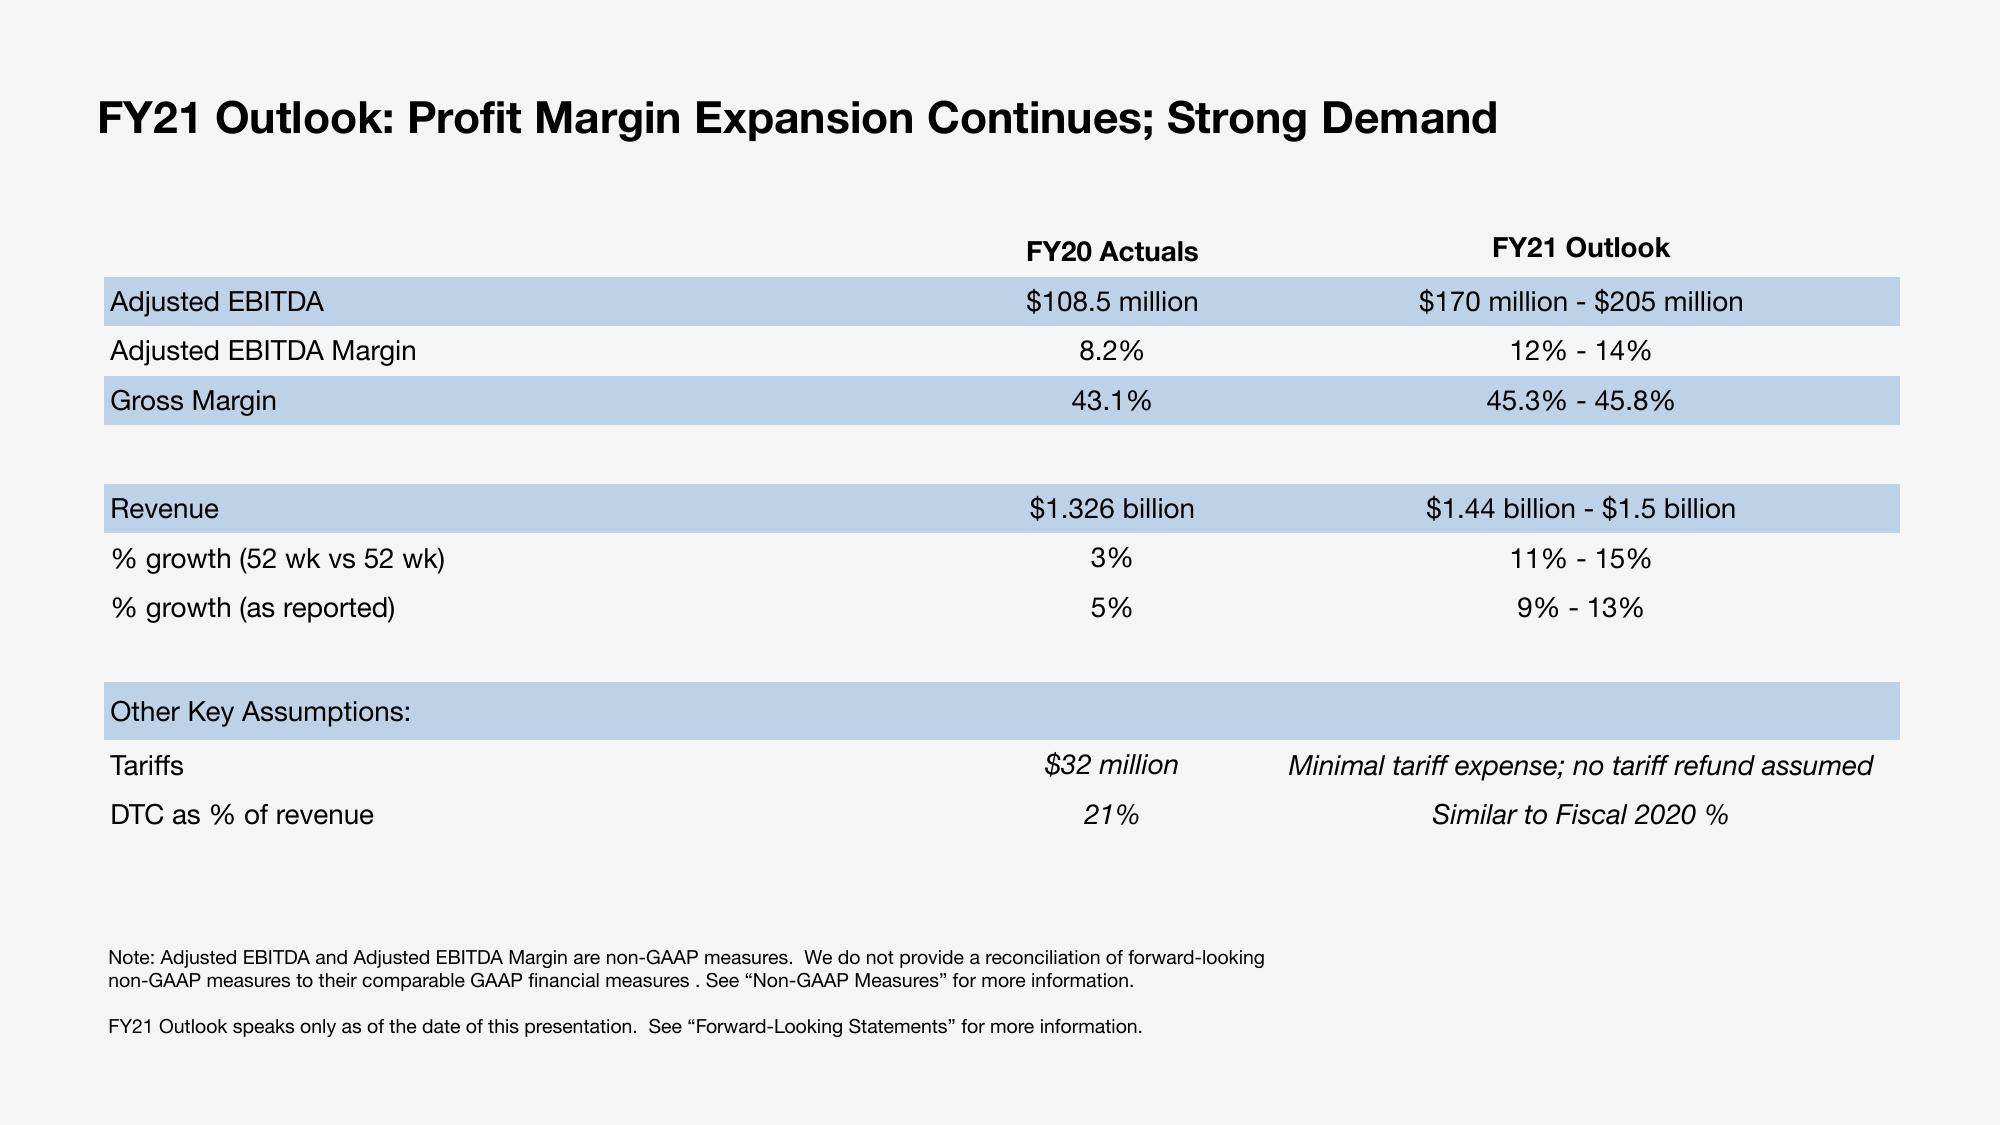
FY21 Outlook: Profit Margin Expansion Continues; Strong Demand
Adjusted EBITDA
Adjusted EBITDA Margin
Gross Margin
Revenue
% growth (52 wk vs 52 wk)
% growth (as reported)
Other Key Assumptions:
Tariffs
DTC as % of revenue
FY20 Actuals
$108.5 million
8.2%
43.1%
$1.326 billion
3%
5%
$32 million
21%
Note: Adjusted EBITDA and Adjusted EBITDA Margin are non-GAAP measures. We do not provide a reconciliation of forward-looking
non-GAAP measures to their comparable GAAP financial measures. See "Non-GAAP Measures" for more information.
FY21 Outlook speaks only as of the date of this presentation. See "Forward-Looking Statements" for more information.
FY21 Outlook
$170 million $205 million
12% -14%
45.3% - 45.8%
11
$1.44 billion - $1.5 billion
11% - 15%
9% -13%
Minimal tariff expense; no tariff refund assumed
Similar to Fiscal 2020 %View entire presentation