Overstock Results Presentation Deck
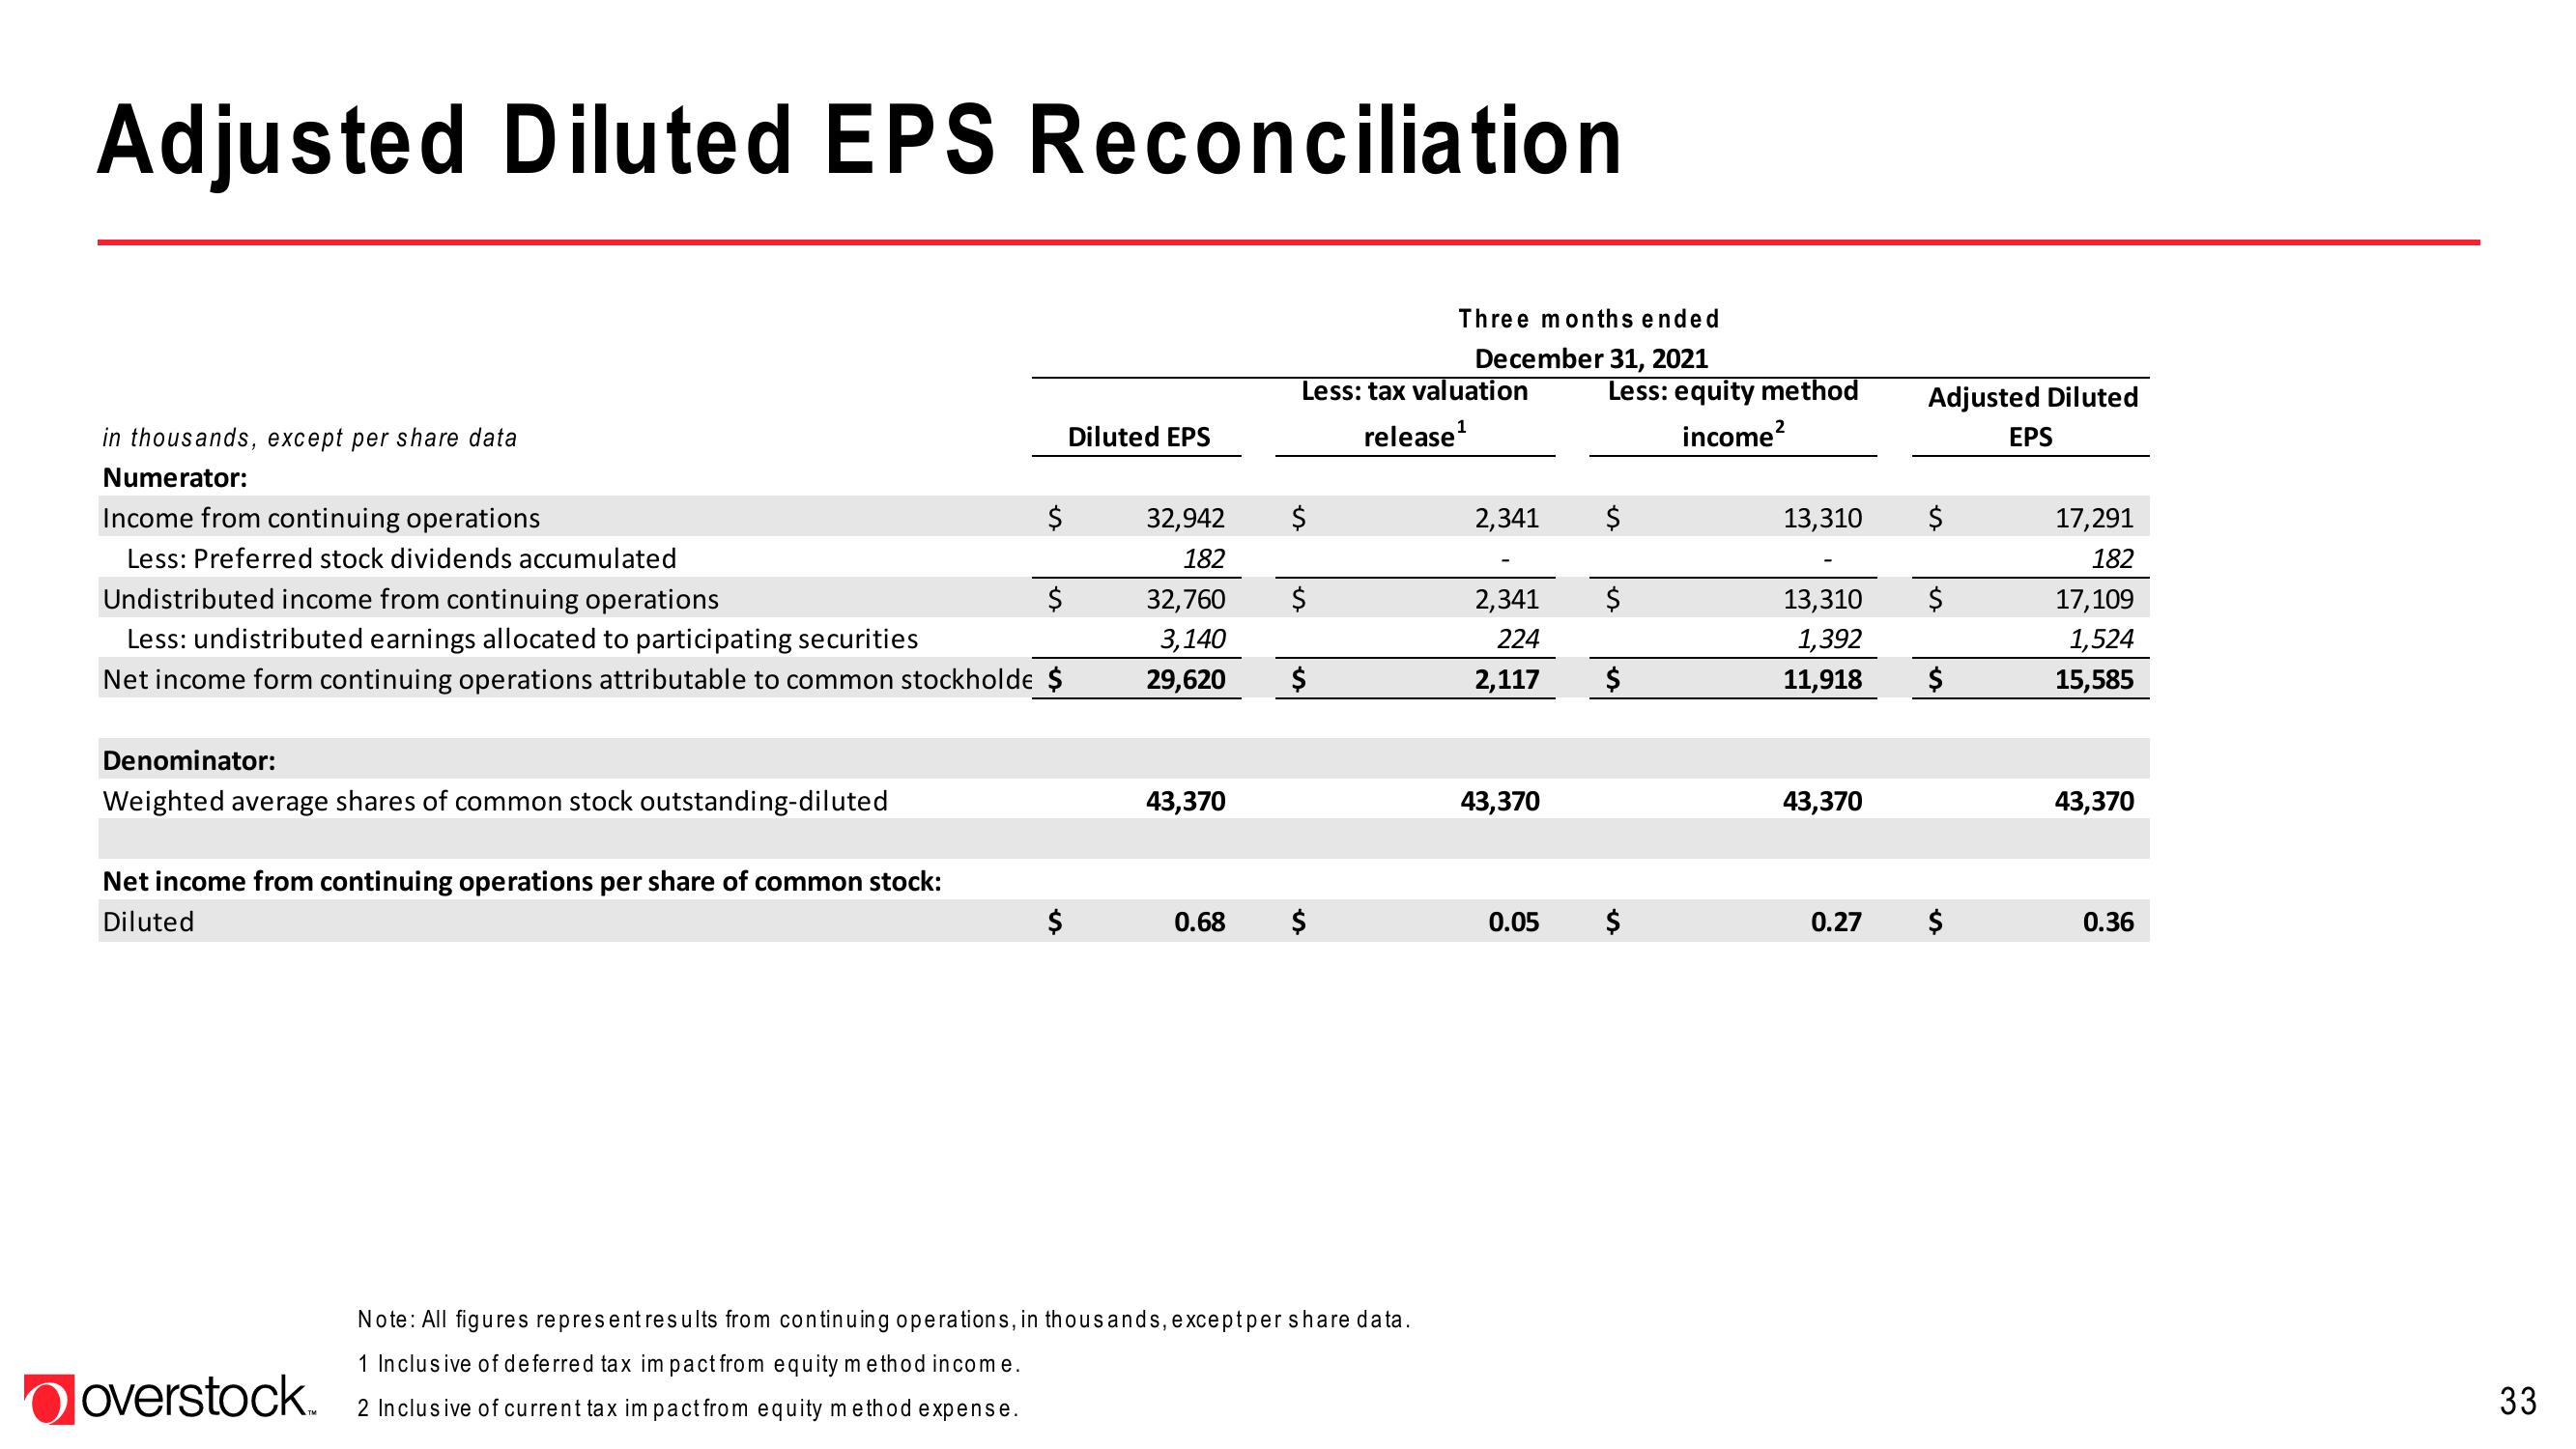
Adjusted Diluted EPS Reconciliation
in thousands, except per share data
Numerator:
Income from continuing operations
Less: Preferred stock dividends accumulated
Denominator:
Weighted average shares of common stock outstanding-diluted
Undistributed income from continuing operations
Less: undistributed earnings allocated to participating securities
Net income form continuing operations attributable to common stockholde $
Net income from continuing operations per share of common stock:
Diluted
$
overstock.
$
$
Diluted EPS
32,942
182
32,760
3,140
29,620
43,370
Less: tax valuation
1
release ¹
$
$
$
0.68 $
Three months ended
December 31, 2021
Note: All figures represent results from continuing operations, in thousands, exceptper share data.
1 Inclusive of deferred tax im pact from equity method income.
2 Inclusive of current tax impact from equity method expense.
2,341
2,341
224
2,117
43,370
0.05
Less: equity method
income²
$
$
$
13,310
13,310
1,392
11,918
43,370
0.27
Adjusted Diluted
$
$
$
$
EPS
17,291
182
17,109
1,524
15,585
43,370
0.36
33View entire presentation