Synchrony Financial Results Presentation Deck
Financial Results
Summary earnings statement
$ in millions, except per share statistics
Total interest income
Total interest expense
Net interest income (NII)
Retailer share arrangements (RSA)
Provision for credit losses
Other income
Other expense
Pre-tax earnings
Provision for income taxes
Net earnings
Preferred dividends
Net earnings available to common
stockholders
Diluted earnings per share
synchrony
1Q'21 1Q'20 $
%
$3,742 $4,407 $(665) (15)%
303
517 214
(451)
(63)
3,439
3,890
(989) (926)
334
131
932
1,315
290
1,025
11
$1,014
1,677 1,343
97
1,002
B/(W)
286
34
382 933
11
70
0
41%
(12)%
(7)%
$1.73 $0.45 $1.28
80%
96 (194) (202)%
739 258%
35%
7%
244%
0%
$275 $739 269%
1Q'21 Highlights
●
●
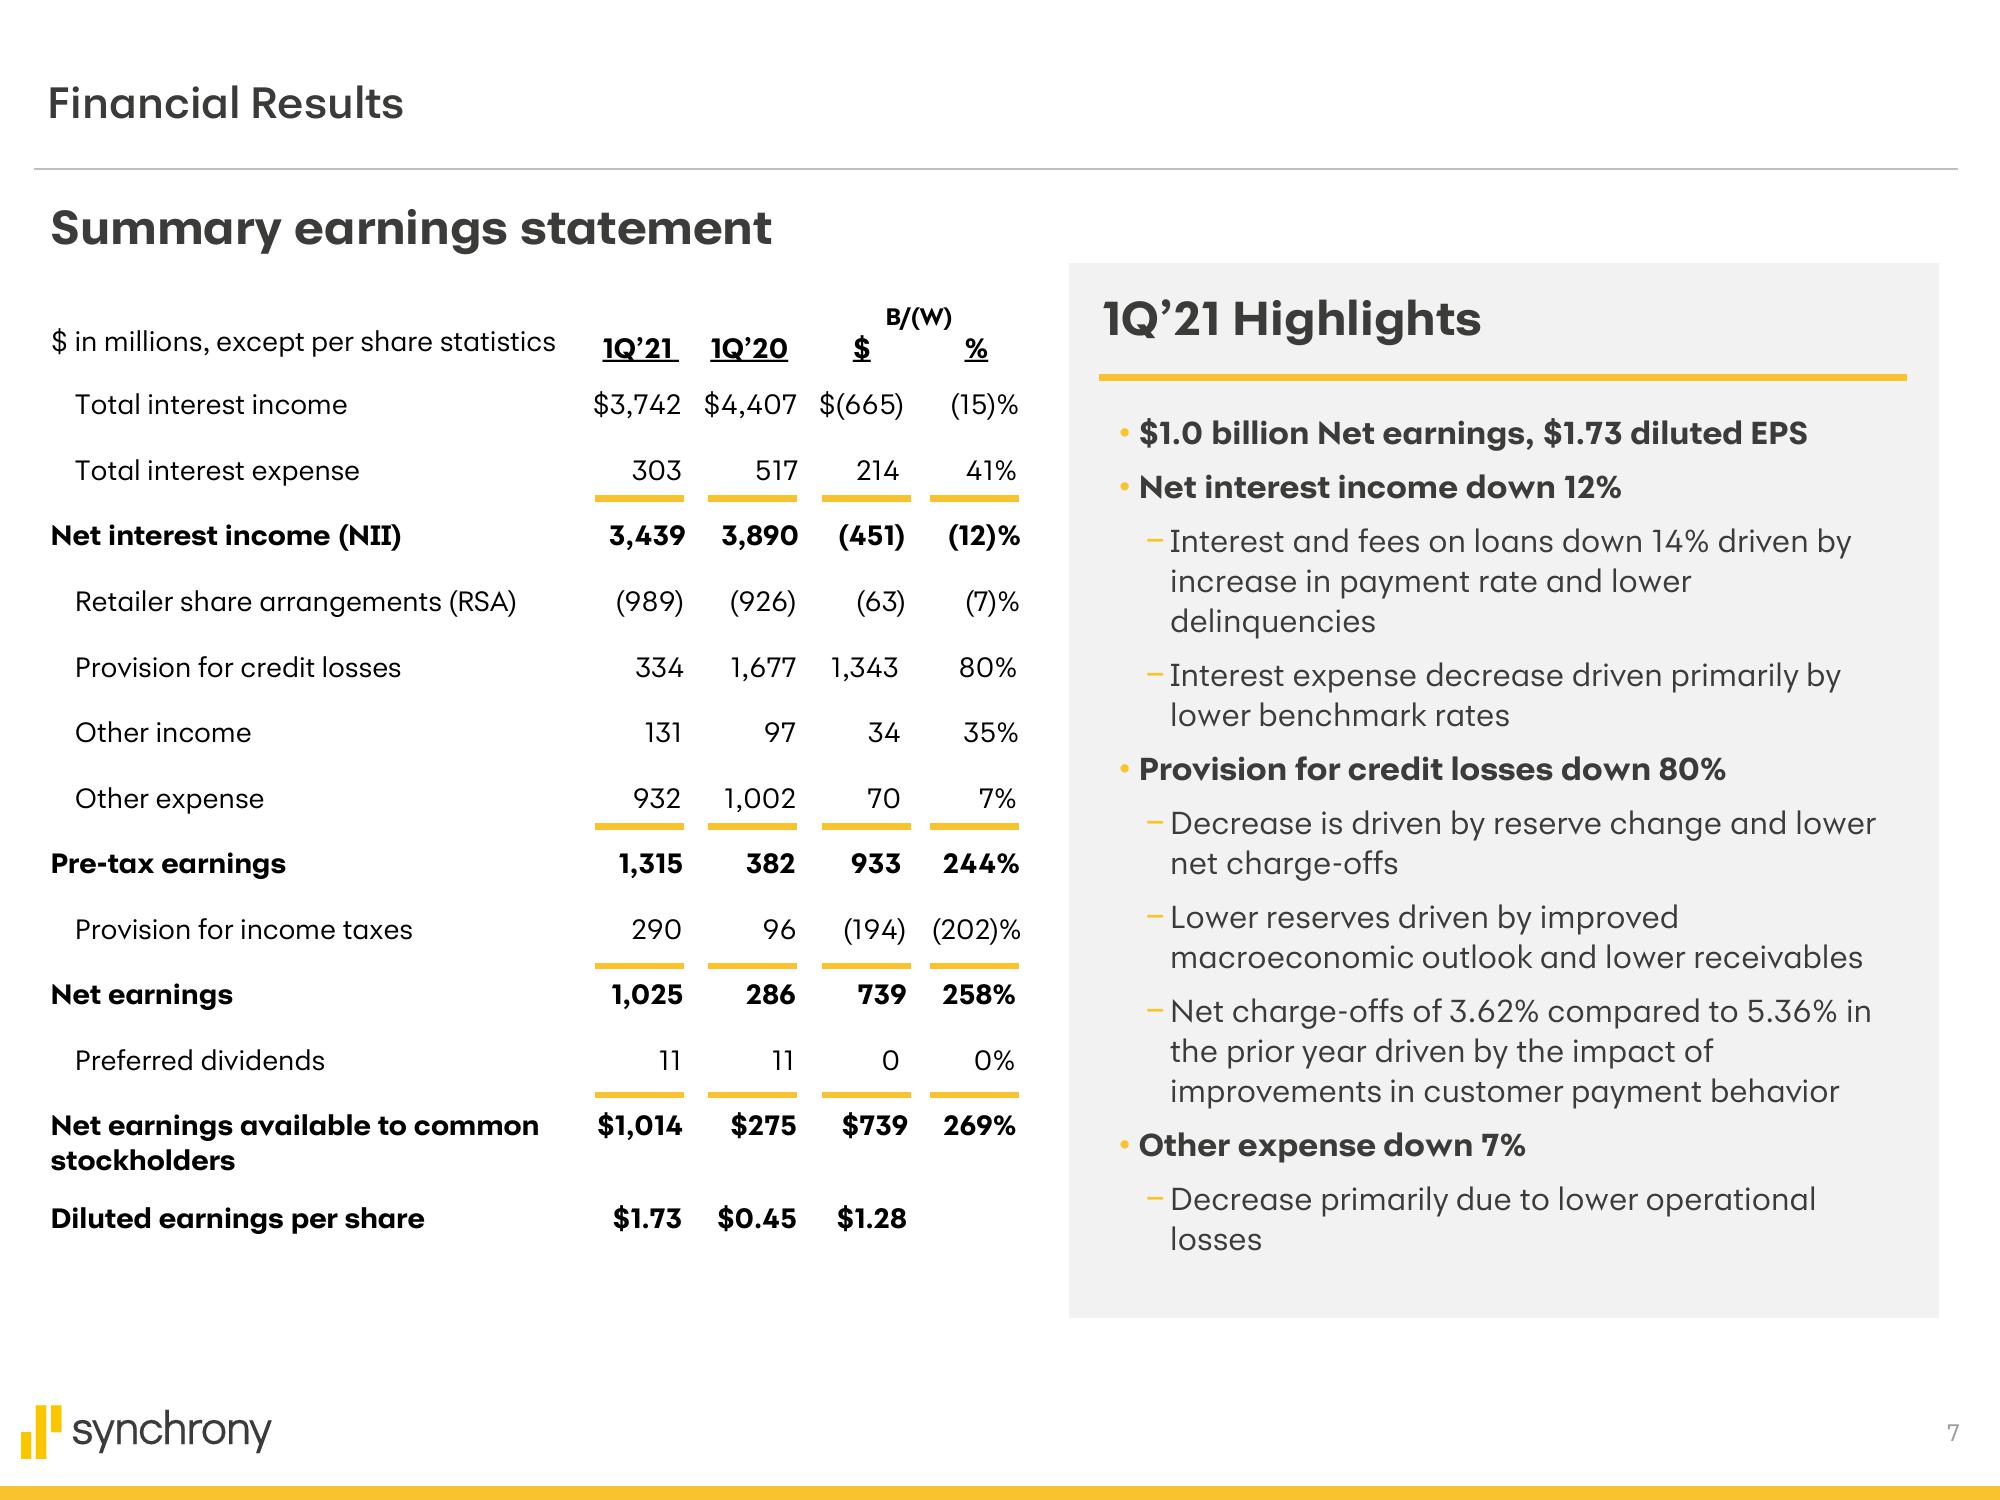
$1.0 billion Net earnings, $1.73 diluted EPS
Net interest income down 12%
Interest and fees on loans down 14% driven by
increase in payment rate and lower
delinquencies
- Interest expense decrease driven primarily by
lower benchmark rates
Provision for credit losses down 80%
Decrease is driven by reserve change and lower
net charge-offs
Lower reserves driven by improved
macroeconomic outlook and lower receivables
Net charge-offs of 3.62% compared to 5.36% in
the prior year driven by the impact of
improvements in customer payment behavior
Other expense down 7%
Decrease primarily due to lower operational
losses
7View entire presentation