Hydrafacial Results Presentation Deck
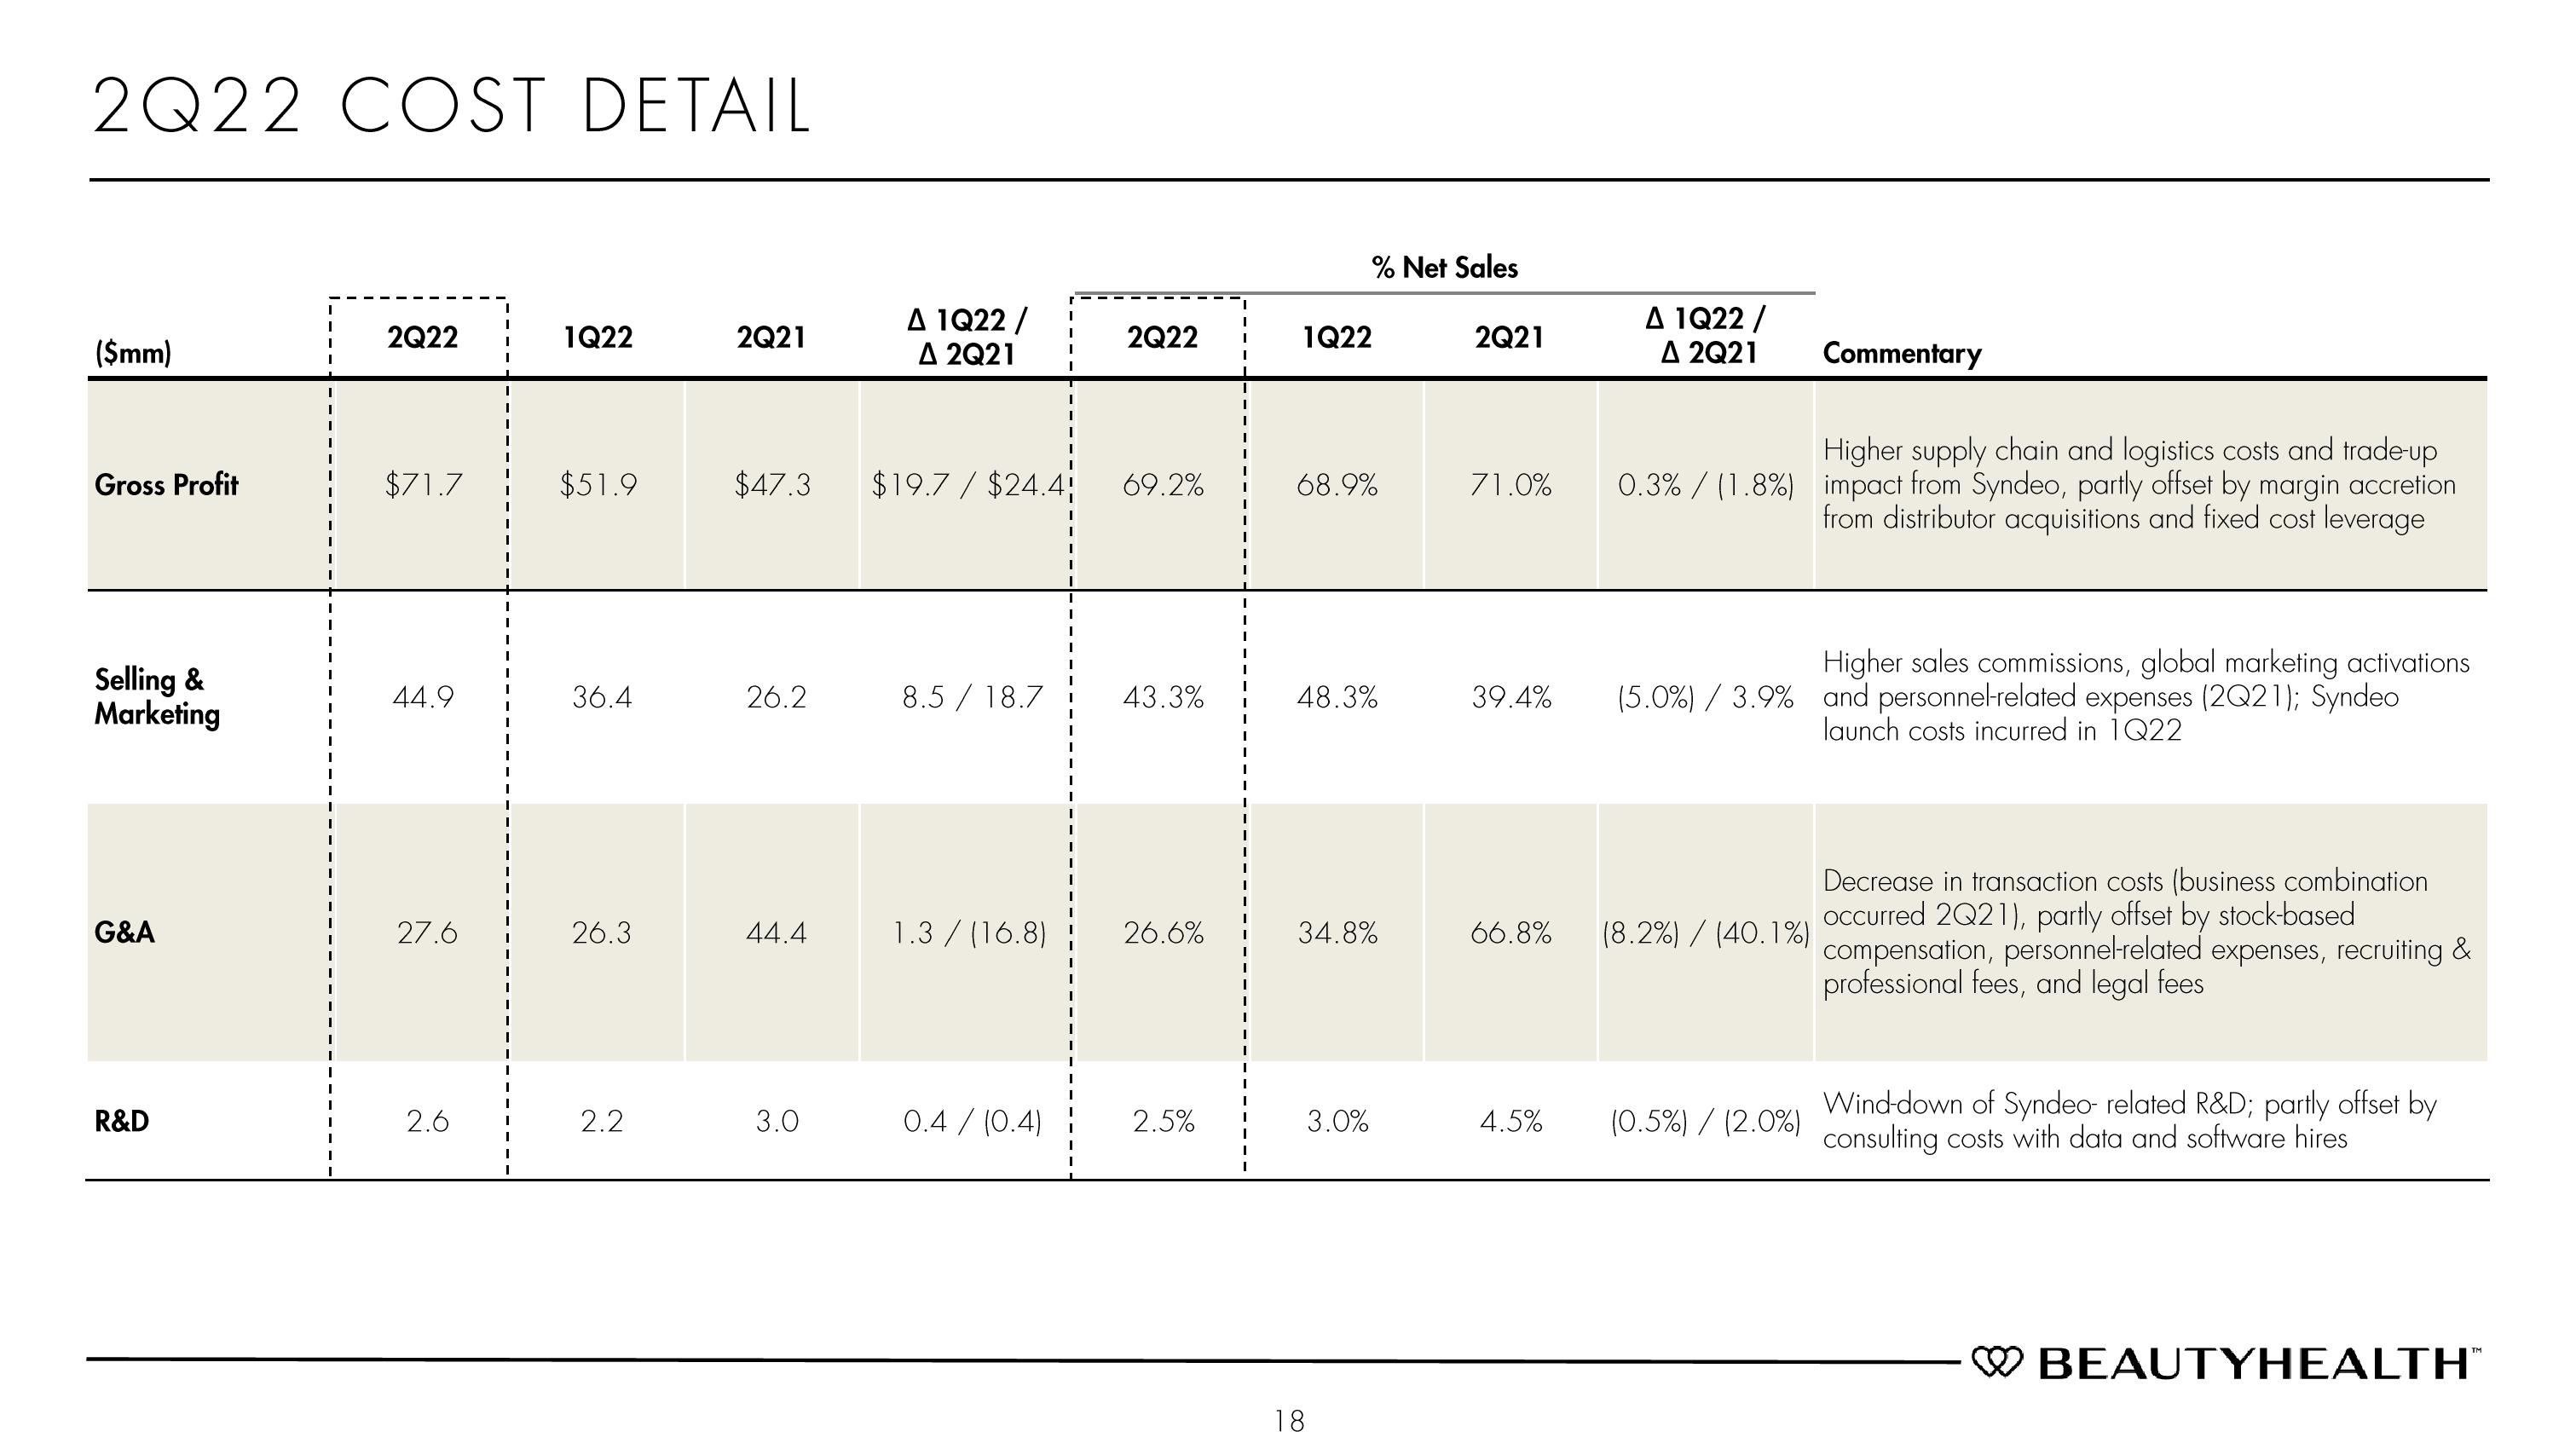
2Q22 COST DETAIL
($mm)
Gross Profit
Selling &
Marketing
G&A
R&D
I
T
I
T
2Q22
$71.7
44.9
27.6
2.6
1
I
T
1
I
I
I
I
I
T
I
I
I
I
I
I
1Q22 2Q21
$51.9
36.4
26.3
2.2
$47.3
26.2
44.4
3.0
Δ 1Q22 /
A 2Q21
$19.7/ $24.4
8.5 / 18.7
1.3/(16.8)
J
0.4 / (0.4)
I
I
I
I
I
I
T
I
I
1
I
I
I
2Q22
69.2%
43.3%
26.6%
2.5%
T
I
I
1
I
11
1
I
I
1
1
T
11
1
T
T
1
T
1
T
I
I
I
I
I
I
1Q22
% Net Sales
68.9%
48.3%
34.8%
18
3.0%
2Q21
71.0%
39.4%
66.8%
A 1Q22/
A 2Q21
Higher supply chain and logistics costs and trade-up
0.3% (1.8%) impact from Syndeo, partly offset by margin accretion
from distributor acquisitions and fixed cost leverage
Commentary
Higher sales commissions, global marketing activations
(5.0%) / 3.9% and personnel-related expenses (2Q21); Syndeo
launch costs incurred in 1Q22
(8.2%)/(40.1%)
4.5% (0.5%) / (2.0%)
Decrease in transaction costs (business combination
occurred 2Q21), partly offset by stock-based
compensation, personnel-related expenses, recruiting &
professional fees, and legal fees
Wind-down of Syndeo- related R&D; partly offset by
consulting costs with data and software hires
BEAUTYHEALTHView entire presentation