Tesla Results Presentation Deck
18
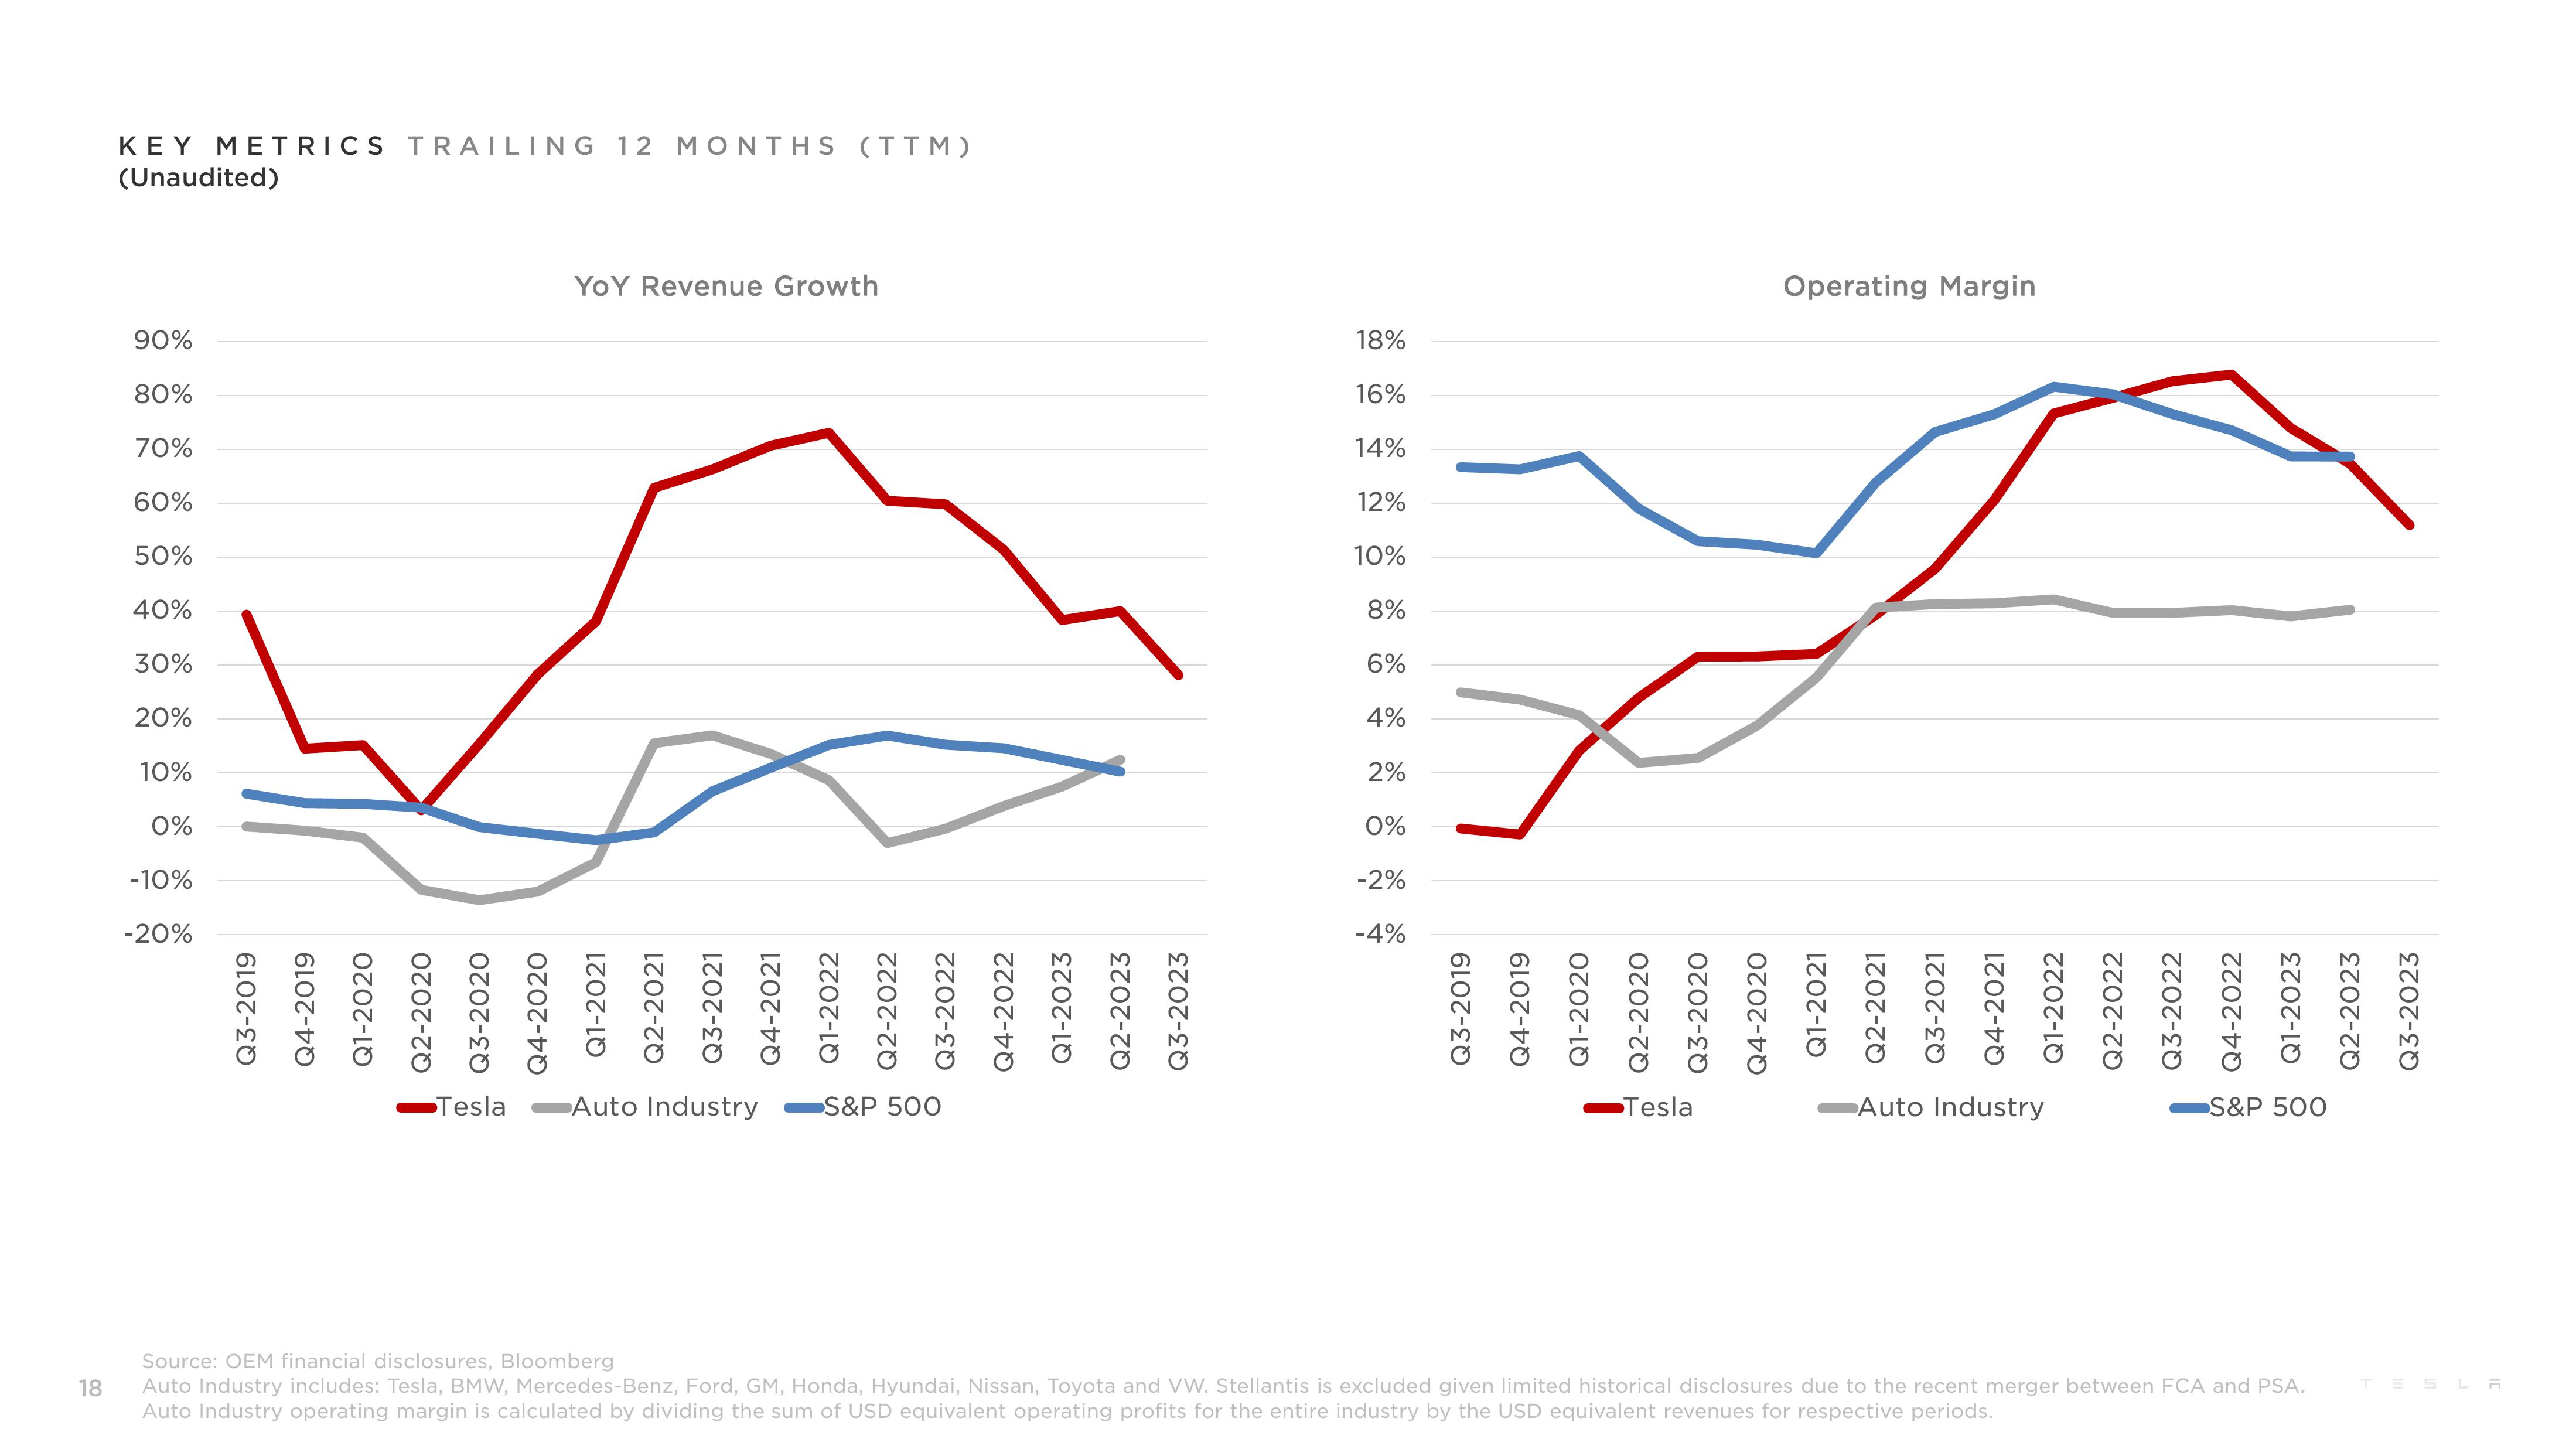
KEY METRICS TRAILING 12 MONTHS (TTM)
(Unaudited)
90%
80%
70%
60%
50%
40%
30%
20%
10%
0%
-10%
-20%
YOY Revenue Growth
Q3-2019
Q4-2019
Q1-2020
Q2-2020
Q3-2020
Q4-2020
Q1-2021
Q2-2021
Q3-2021
Q4-2021
Q1-2022
Q2-2022
Q3-2022
Q4-2022
Q1-2023
Tesla Auto Industry S&P 500
Q2-2023
Q3-2023
18%
16%
14%
12%
10%
8%
6%
4%
2%
0%
-2%
-4%
Operating Margin
Q3-2019
Q4-2019
Q1-2020
Q2-2020
Q3-2020
Q4-2020
Q1-2021
Q2-2021
Q3-2021
Q4-2021
Q1-2022
Q2-2022
Q3-2022
Q4-2022
Q1-2023
Q2-2023
Q3-2023
Tesla
Auto Industry
-S&P 500
Source: OEM financial disclosures, Bloomberg
Auto Industry includes: Tesla, BMW, Mercedes-Benz, Ford, GM, Honda, Hyundai, Nissan, Toyota and VW. Stellantis is excluded given limited historical disclosures due to the recent merger between FCA and PSA. TESLA
Auto Industry operating margin is calculated by dividing the sum of USD equivalent operating profits for the entire industry by the USD equivalent revenues for respective periods.View entire presentation