J.P.Morgan Results Presentation Deck
JPMORGAN CHASE & CO.
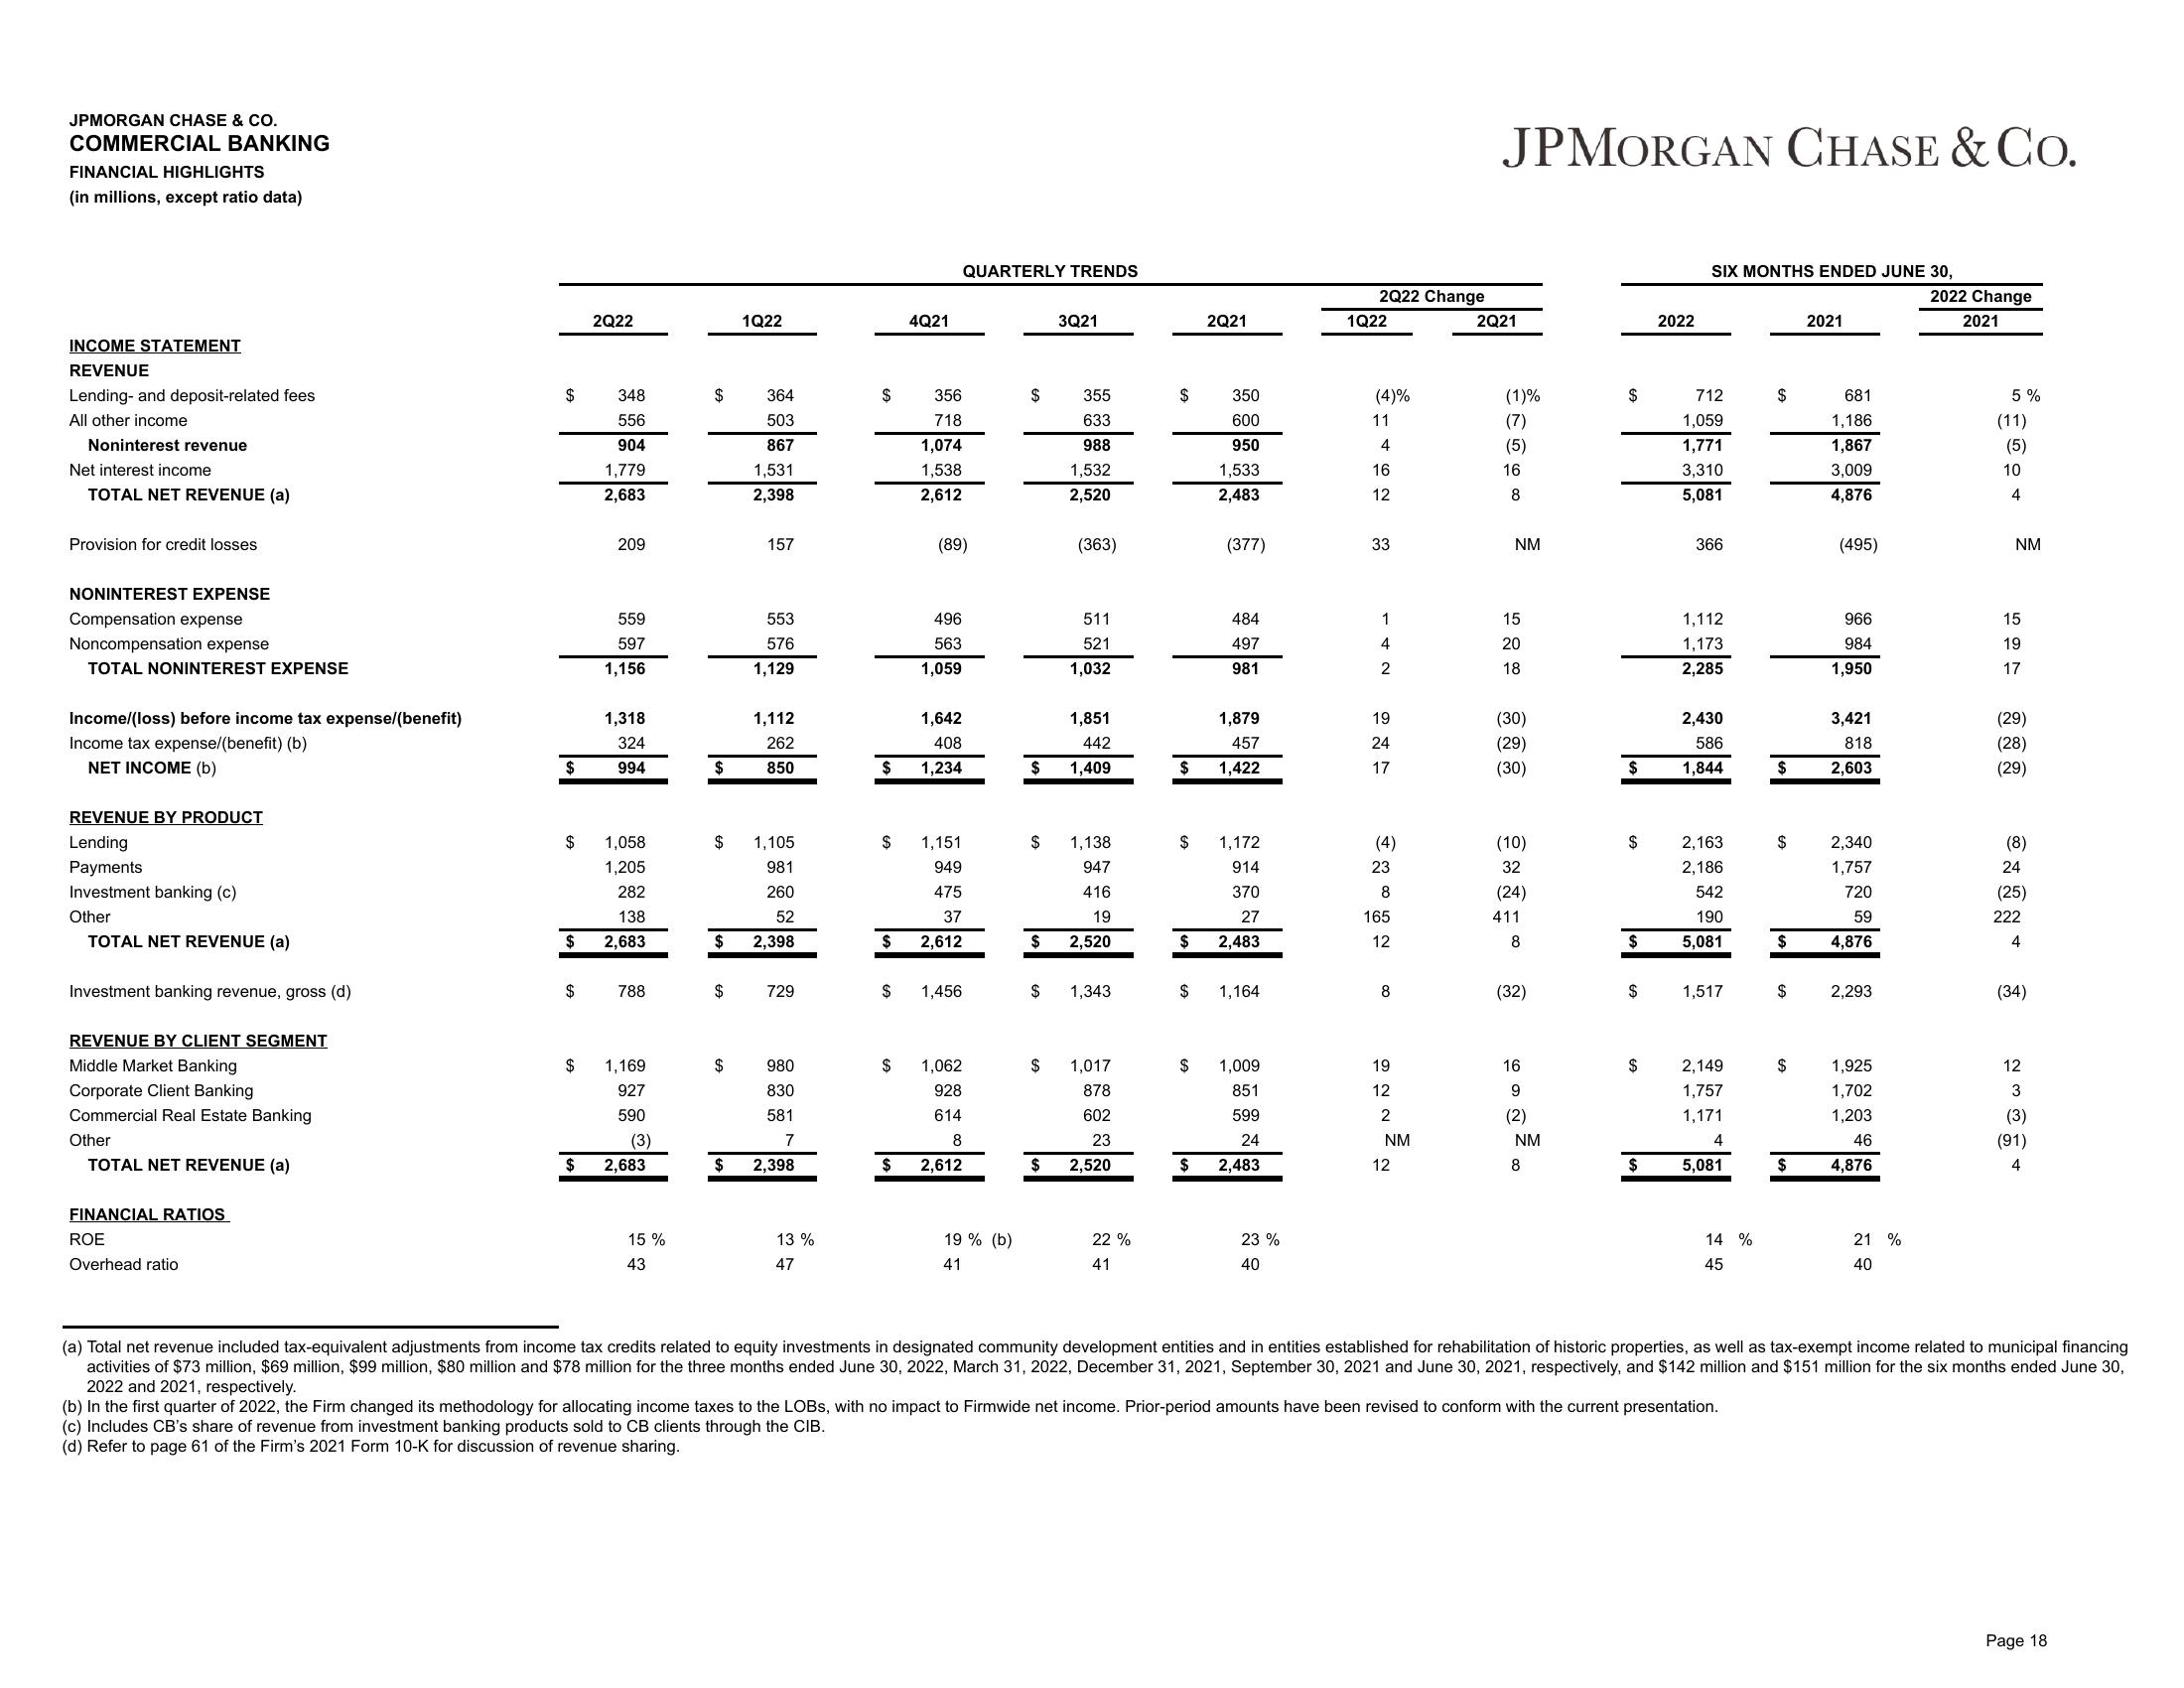
COMMERCIAL BANKING
FINANCIAL HIGHLIGHTS
(in millions, except ratio data)
INCOME STATEMENT
REVENUE
Lending- and deposit-related fees
All other income
Noninterest revenue
Net interest income
TOTAL NET REVENUE (a)
Provision for credit losses
NONINTEREST EXPENSE
Compensation expense
Noncompensation expense
TOTAL NONINTEREST EXPENSE
Income/(loss) before income tax expense/(benefit)
Income tax expense/(benefit) (b)
NET INCOME (b)
REVENUE BY PRODUCT
Lending
Payments
Investment banking (c)
Other
TOTAL NET REVENUE (a)
Investment banking revenue, gross (d)
REVENUE BY CLIENT SEGMENT
Middle Market Banking
Corporate Client Banking
Commercial Real Estate Banking
Other
TOTAL NET REVENUE (a)
FINANCIAL RATIOS
ROE
Overhead ratio
$
$
$
$
$
$
$
2Q22
348
556
904
1,779
2,683
209
559
597
1,156
1,318
324
994
1,058
1,205
282
138
2,683
788
1,169
927
590
(3)
2,683
15 %
43
$
$
$
$
$
1Q22
364
503
867
1,531
2,398
157
553
576
1,129
1,112
262
850
1,105
981
260
52
2,398
729
980
830
581
7
$ 2,398
13%
47
$
$
$
$
$
4Q21
$
356
718
1,074
1,538
2,612
(89)
496
563
1,059
1,642
408
1,234
QUARTERLY TRENDS
1,151
949
475
37
2,612
1,456
$ 1,062
928
614
8
2,612
19% (b)
41
$
$
$
3Q21
355
633
988
1,532
2,520
(363)
$
511
521
1,032
1,851
442
1,409
1,138
947
416
19
$ 2,520
$ 1,343
1,017
878
602
23
$ 2,520
22%
41
$
$
$
$
$
2Q21
$
350
600
950
1,533
2,483
(377)
484
497
981
1,879
457
1,422
1,172
914
370
27
2,483
1,164
1,009
851
599
24
$ 2,483
23 %
40
2Q22 Change
1Q22
(4)%
11
4
16
12
33
1
4
2
19
24
17
(4)
23
8
165
12
8
19
12
2
NM
12
JPMORGAN CHASE & Co.
2Q21
(1)%
(7)
(5)
16
8
NM
15
20
18
(30)
(29)
(30)
(10)
32
(24)
411
8
(32)
16
9
(2)
NM
8
$
$
$
$
$
2022
$
SIX MONTHS ENDED JUNE 30,
712
1,059
1,771
3,310
5,081
366
2,163
2,186
542
190
$ 5,081
1,112
1,173
2,285
2,430
586
1,844
1,517
2,149
1,757
1,171
4
5,081
14 %
45
$
$
$
$
$
$
$
2021
681
1,186
1,867
3,009
4,876
(495)
966
984
1,950
3,421
818
2,603
2,340
1,757
720
59
4,876
2,293
1,925
1,702
1,203
46
4,876
21 %
40
2022 Change
2021
5 %
(11)
(5)
10
4
NM
15
19
17
(29)
(28)
(29)
(8)
24
(25)
222
4
(34)
12
3
(3)
(91)
4
(a) Total net revenue included tax-equivalent adjustments from income tax credits related to equity investments in designated community development entities and in entities established for rehabilitation of historic properties, as well as tax-exempt income related to municipal financing
activities of $73 million, $69 million, $99 million, $80 million and $78 million for the three months ended June 30, 2022, March 31, 2022, December 31, 2021, September 30, 2021 and June 30, 2021, respectively, and $142 million and $151 million for the six months ended June 30,
2022 and 2021, respectively.
(b) In the first quarter of 2022, the Firm changed its methodology for allocating income taxes to the LOBS, with no impact to Firmwide net income. Prior-period amounts have been revised to conform with the current presentation.
(c) Includes CB's share of revenue from investment banking products sold to CB clients through the CIB.
(d) Refer to page 61 of the Firm's 2021 Form 10-K for discussion of revenue sharing.
Page 18View entire presentation