Repay SPAC
Historical and Forecasted Financials
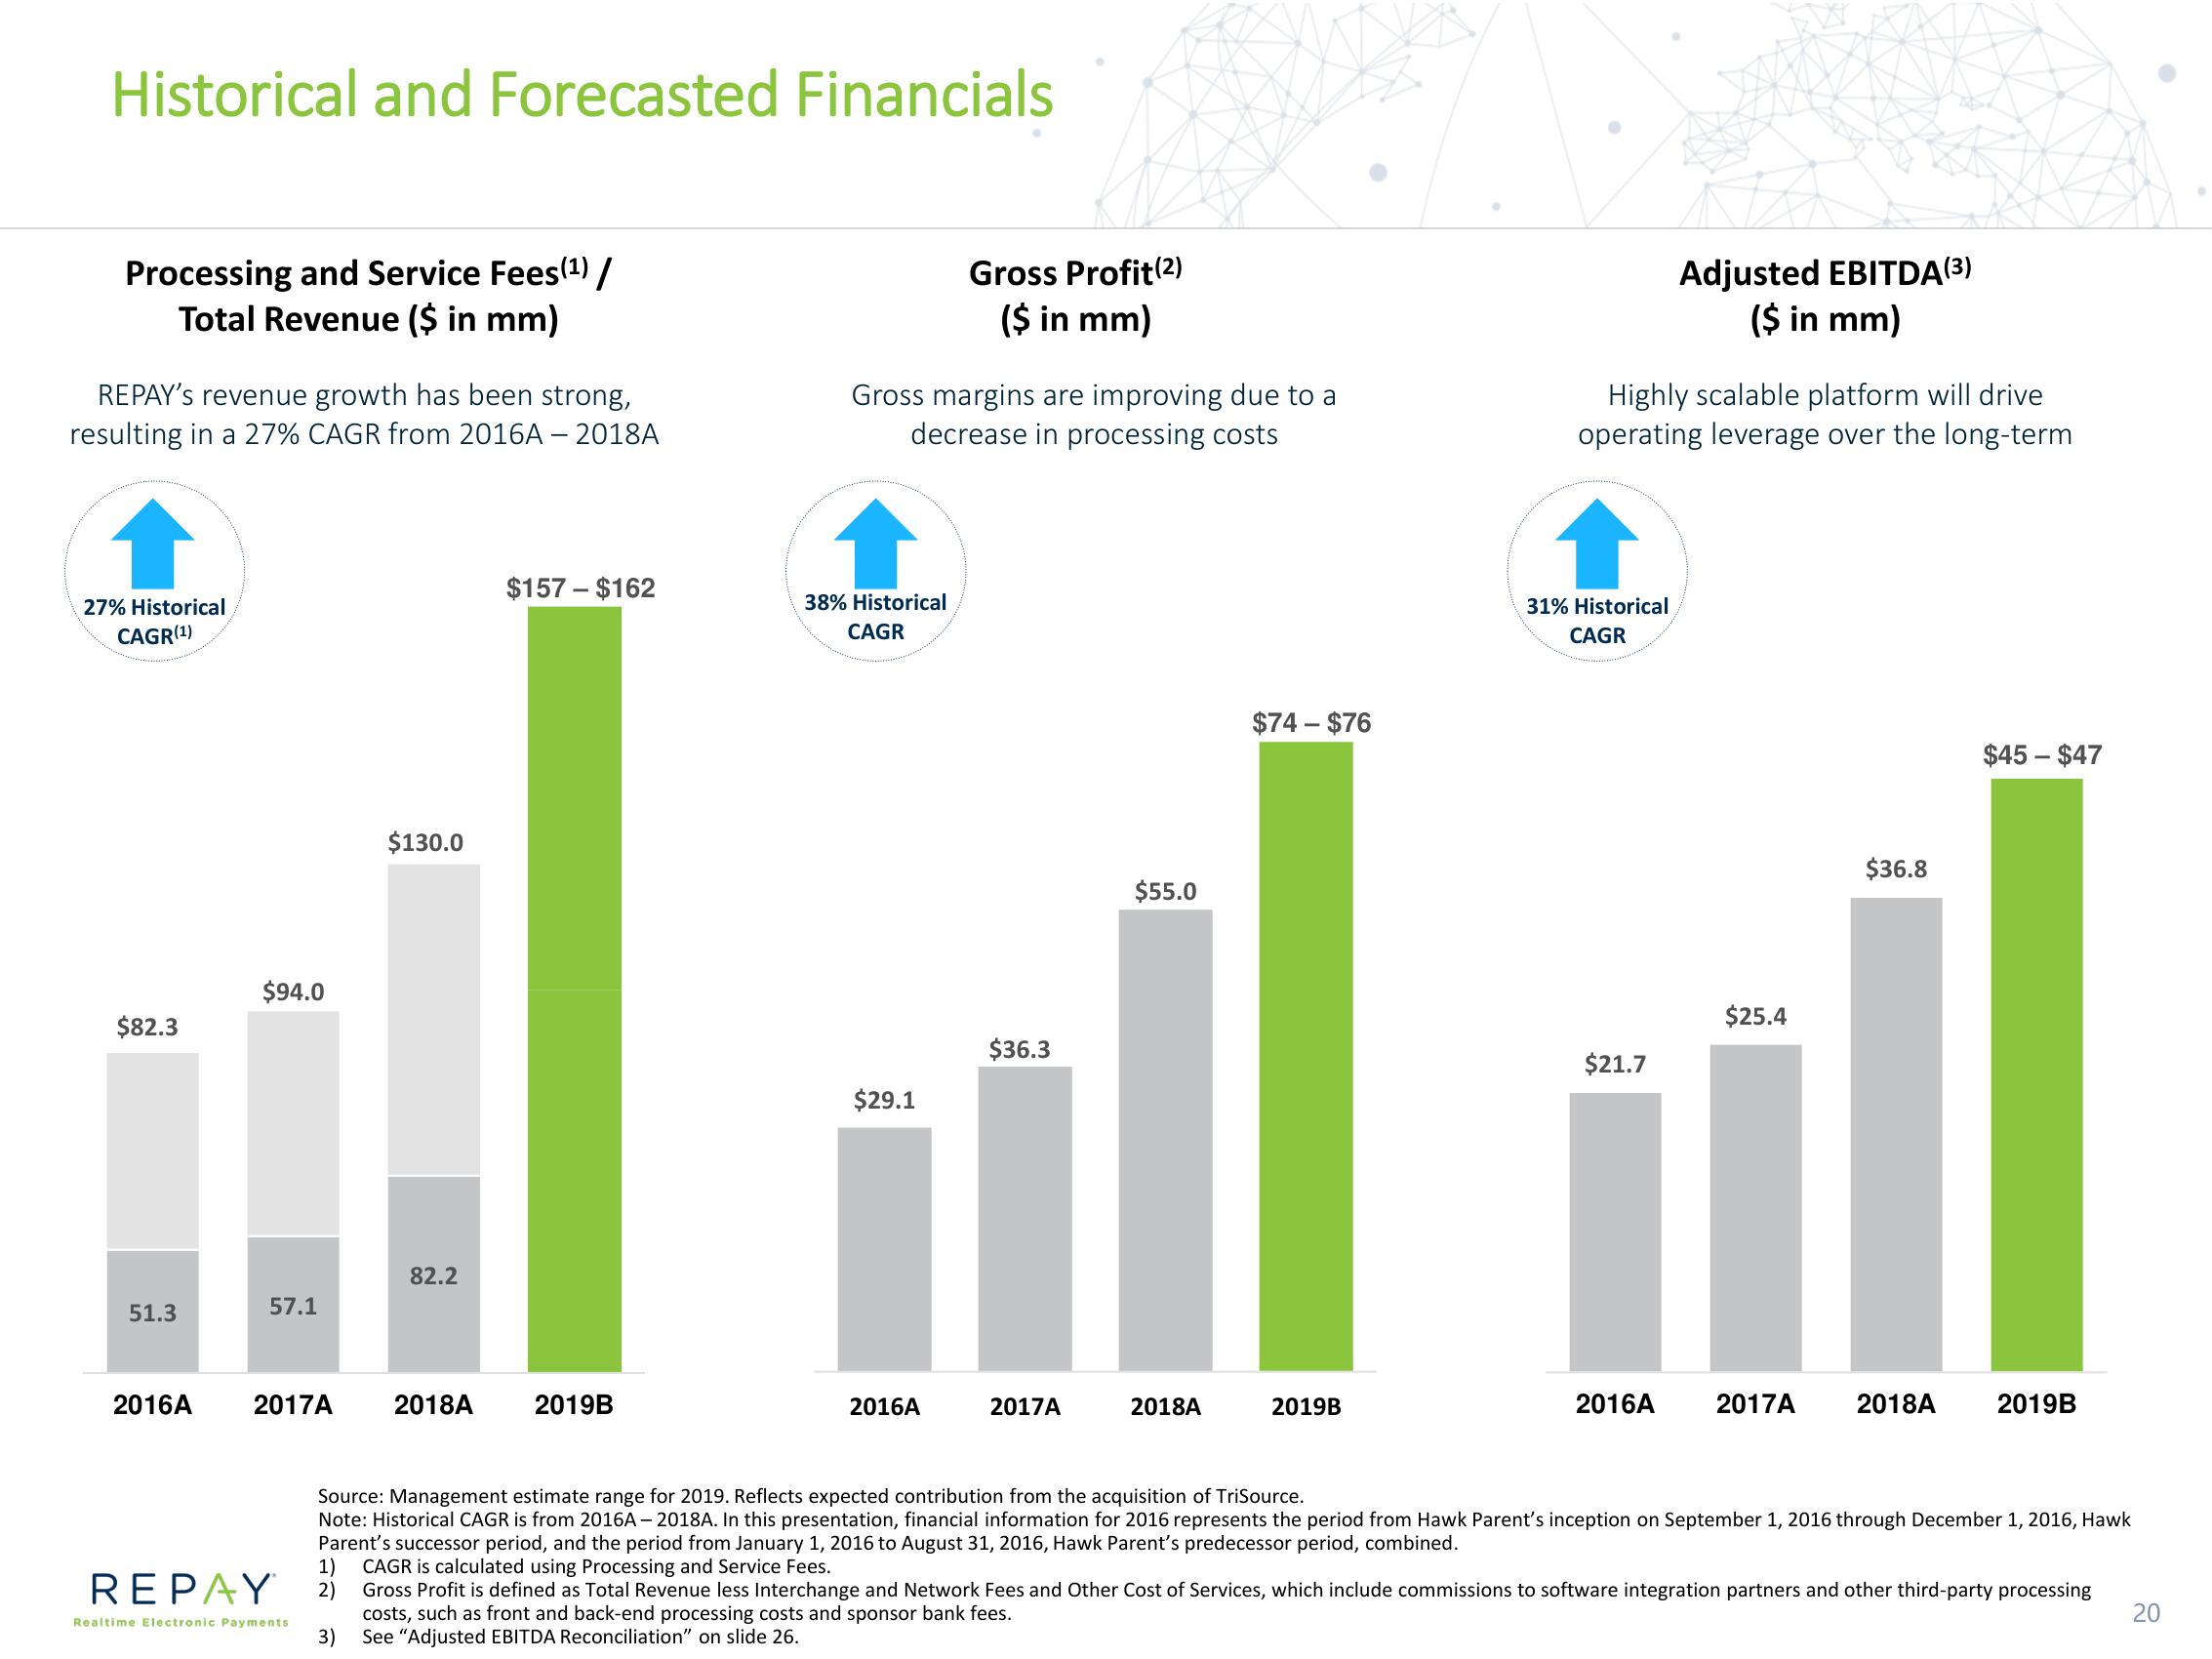
Processing and Service Fees (¹) /
Total Revenue ($ in mm)
REPAY's revenue growth has been strong,
resulting in a 27% CAGR from 2016A - 2018A
27% Historical
CAGR (¹)
$82.3
51.3
2016A
$94.0
57.1
REPAY
Realtime Electronic Payments
$130.0
82.2
2017A 2018A 2019B
1)
2)
3)
$157 - $162
Gross margins are improving due to a
decrease in processing costs
38% Historical
CAGR
$29.1
Gross Profit(²)
($ in mm)
2016A
$36.3
2017A
$55.0
2018A
$74 - $76
2019B
Highly scalable platform will drive
operating leverage over the long-term
31% Historical
CAGR
$21.7
Adjusted EBITDA(3)
($ in mm)
2016A
$25.4
2017A
$36.8
$45 - $47
2018A 2019B
Source: Management estimate range for 2019. Reflects expected contribution from the acquisition of TriSource.
Note: Historical CAGR is from 2016A-2018A. In this presentation, financial information for 2016 represents the period from Hawk Parent's inception on September 1, 2016 through December 1, 2016, Hawk
Parent's successor period, and the period from January 1, 2016 to August 31, 2016, Hawk Parent's predecessor period, combined.
CAGR is calculated using Processing and Service Fees.
Gross Profit is defined as Total Revenue less Interchange and Network Fees and Other Cost of Services, which include commissions to software integration partners and other third-party processing
costs, such as front and back-end processing costs and sponsor bank fees.
See "Adjusted EBITDA Reconciliation" on slide 26.
20View entire presentation