ironSource Results Presentation Deck
Q2 22 INVESTOR PRESENTATION
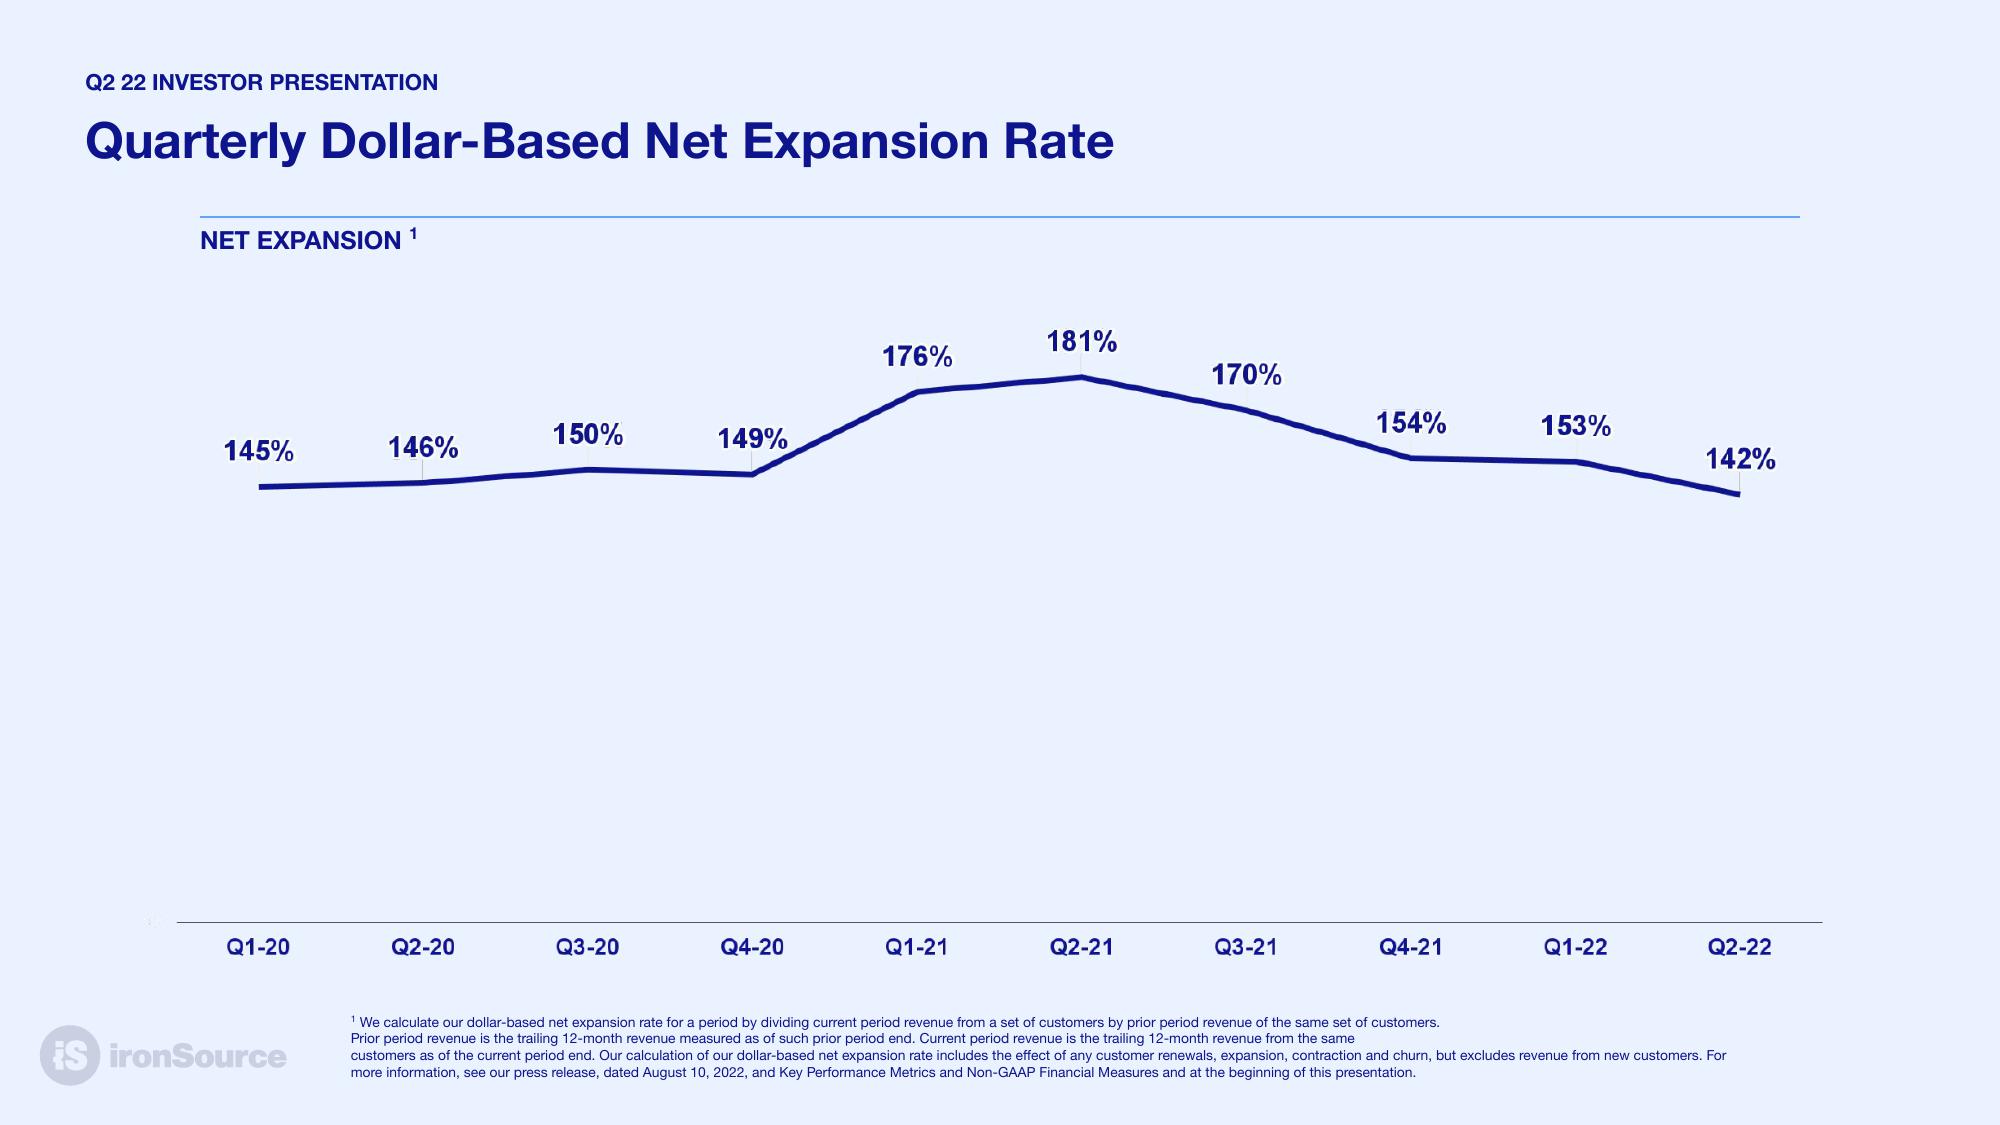
Quarterly Dollar-Based Net Expansion Rate
NET EXPANSION ¹
145%
% 14
Q1-20
146%
IS ironSource
Q2-20
150%1
Q3-20
149%
Q4-20
176%
Q1-21
181%
Q2-21
170%
Q3-21
154%
Q4-21
153%
Q1-22
142%
Q2-22
¹ We calculate our dollar-based net expansion rate for a period by dividing current period revenue from a set of customers by prior period revenue of the same set of customers.
Prior period revenue is the trailing 12-month revenue measured as of such prior period end. Current period revenue is the trailing 12-month revenue from the same
customers as of the current period end. Our calculation of our dollar-based net expansion rate includes the effect of any customer renewals, expansion, contraction and churn, but excludes revenue from new customers. For
more information, see our press release, dated August 10, 2022, and Key Performance Metrics and Non-GAAP Financial Measures and at the beginning of this presentation.View entire presentation