Corphousing Group IPO Presentation Deck slide image

Corphousing Group IPO Presentation Deck

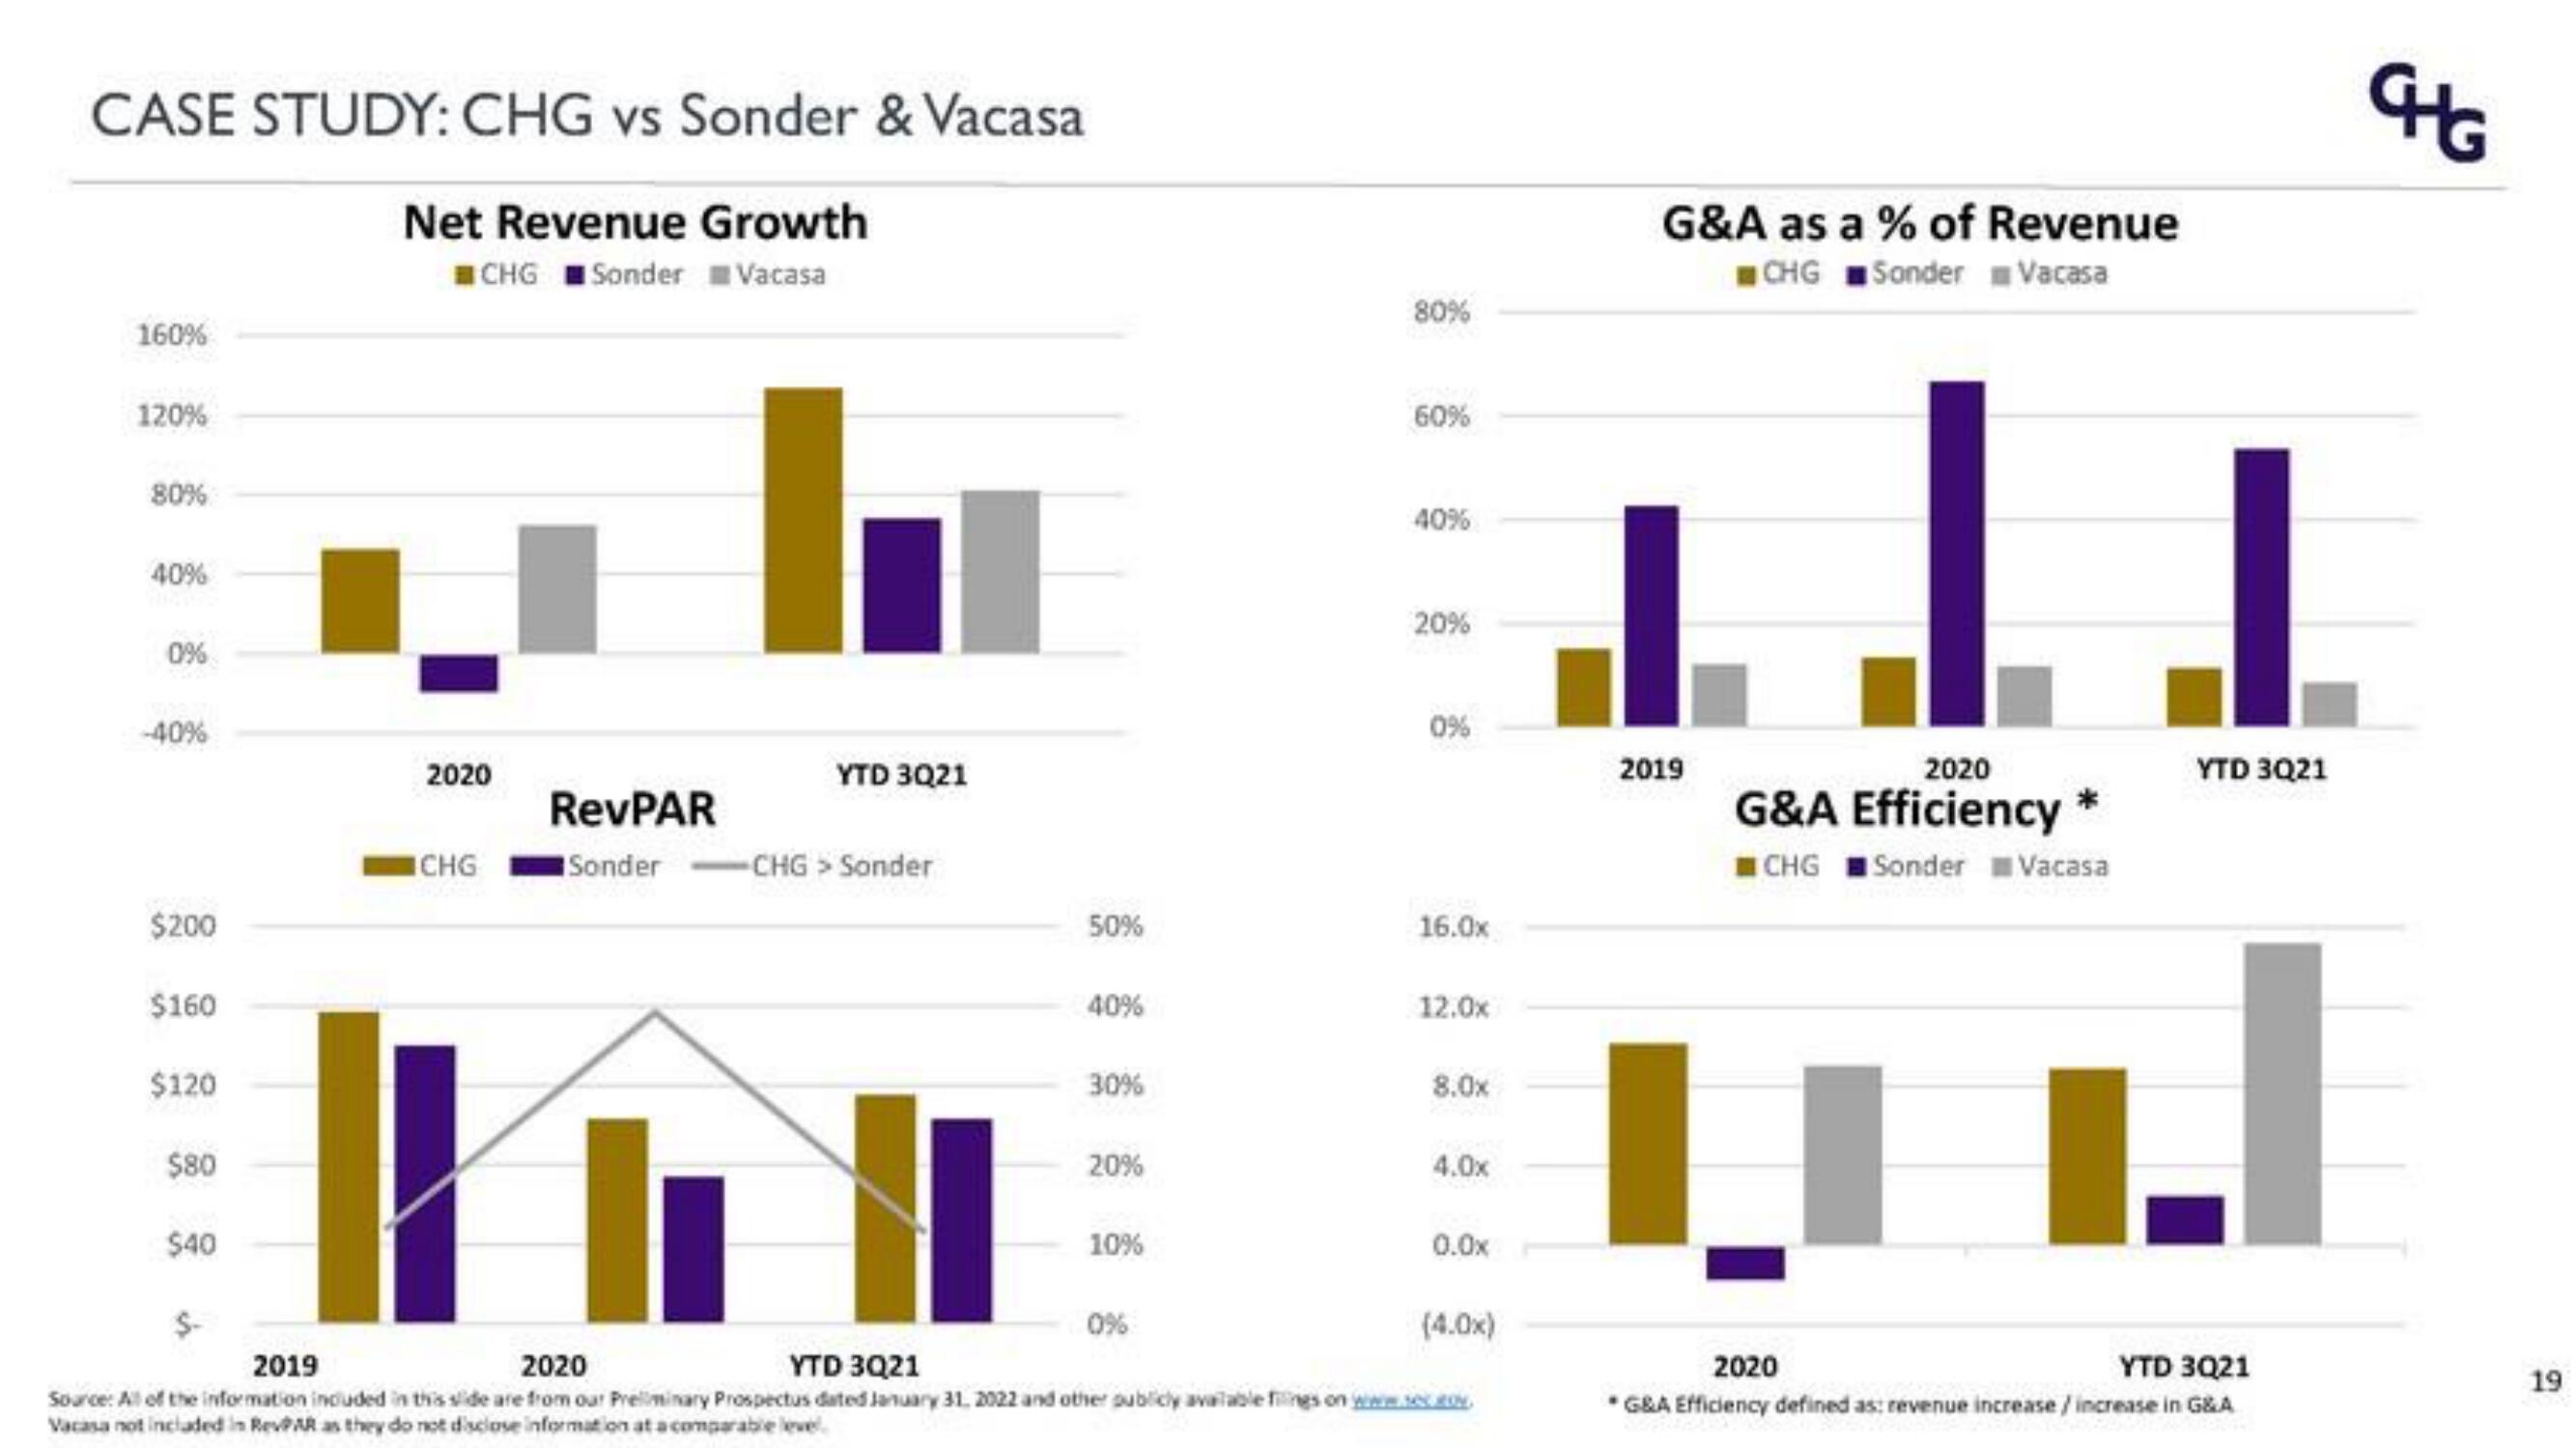
CASE STUDY: CHG vs Sonder & Vacasa Net Revenue Growth CHGSonder Vacasa 160% 120% 80% 40% 0% -40% $200 $160 $120 $80 2020 $40 ICHG YTD 3Q21 RevPAR Sonder -CHG > Sonder 50% 40% 30% 20% 10% 80% I 2019 2020 YTD 3Q21 Source: All of the information included in this side are from our Preliminary Prospectus dated January 31, 2022 and other publicly available filings on www.sec.co. Vacasa not included in RevPAR as they do not disclose information at a comparable leve 0% 60% 40% 20% 0% 16.0x 12.0x 8.0x 4.0x 0.0x (4.0x) G&A as a % of Revenue CHGSonder Vacasa 2019 2020 G&A Efficiency * CHG Sonder Vacasa YTD 3Q21 GHG J I 2020 YTD 3Q21 G&A Efficiency defined as: revenue increase / increase in G&A 19
View entire presentation