PJT Partners Investment Banking Pitch Book
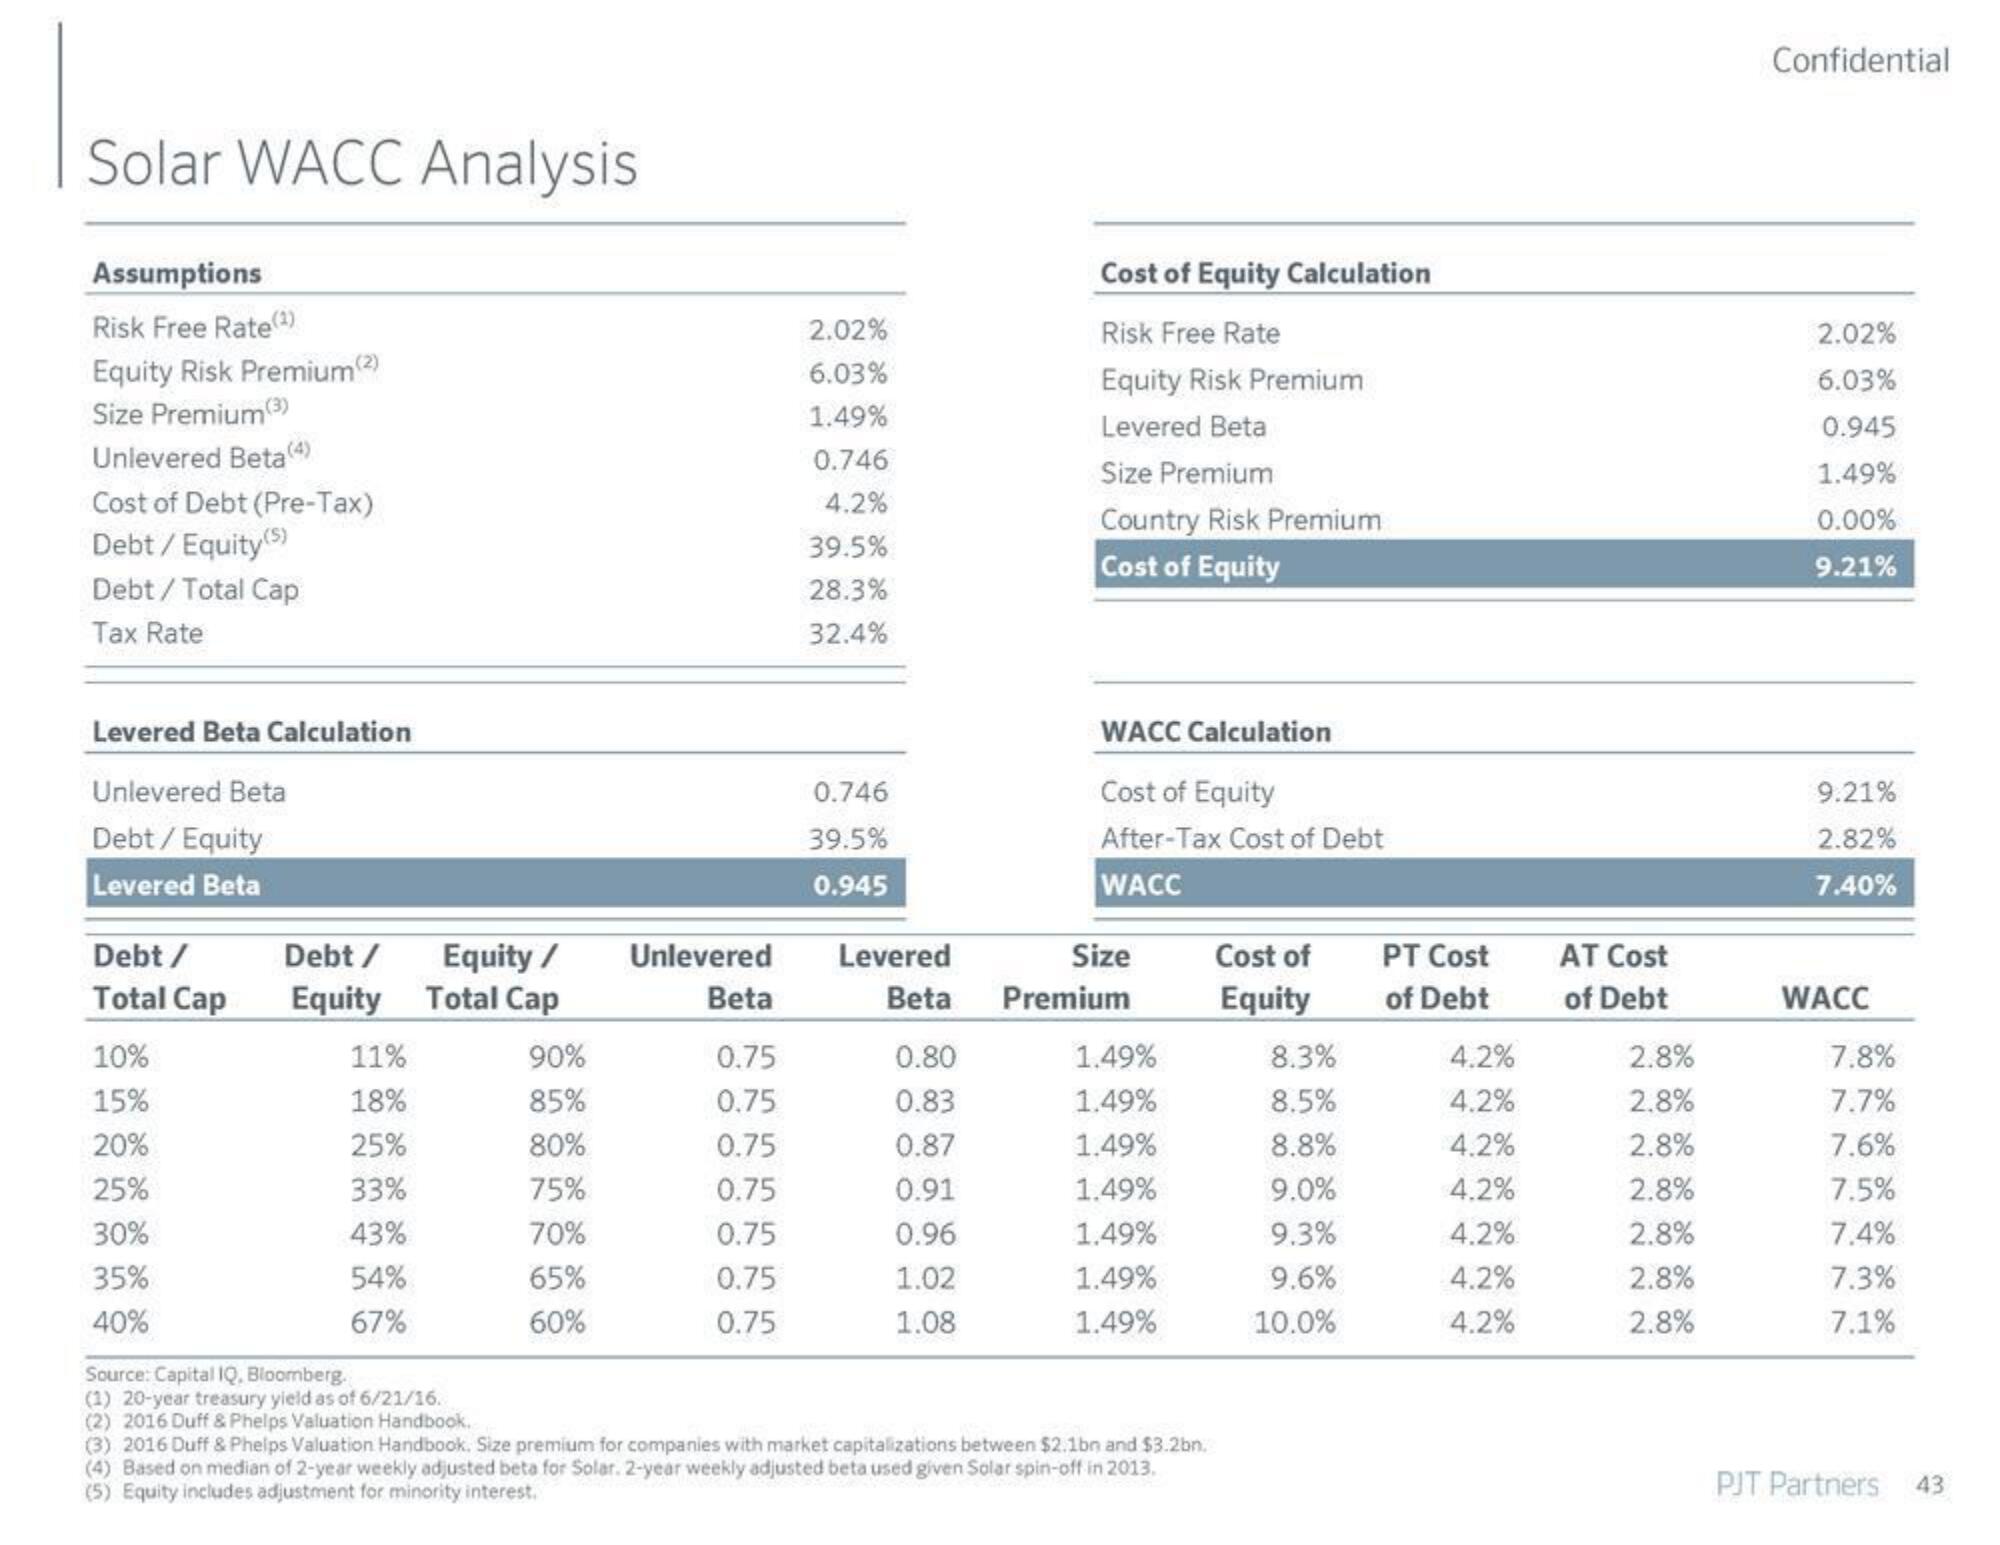
Solar WACC Analysis
Assumptions
Risk Free Rate (¹)
Equity Risk Premium(²)
Size Premium (3)
Unlevered Beta (4)
Cost of Debt (Pre-Tax)
Debt / Equity (⁹)
Debt / Total Cap
Tax Rate
Levered Beta Calculation
Unlevered Beta
Debt / Equity
Levered Beta
Debt /
Total Cap
10%
15%
20%
25%
30%
35%
40%
Debt /
Equity
11%
18%
25%
33%
43%
54%
67%
Equity /
Total Cap
90%
85%
80%
75%
70%
65%
60%
Unlevered
Beta
0.75
0.75
0.75
0.75
0.75
0.75
0.75
2.02%
6.03%
1.49%
0.746
4.2%
39.5%
28.3%
32.4%
0.746
39.5%
0.945
Levered
Cost of Equity Calculation
Risk Free Rate
Equity Risk Premium
Levered Beta
Size Premium
Country Risk Premium
Cost of Equity
0.80
0.83
0.87
0.91
0.96
1.02
1.08
WACC Calculation
Cost of Equity
After-Tax Cost of Debt
WACC
Size
Beta Premium
1.49%
1.49%
1.49%
1.49%
1.49%
1.49%
1.49%
Source: Capital IQ. Bloomberg.
(1) 20-year treasury yield as of 6/21/16.
(2) 2016 Duff & Phelps Valuation Handbook.
(3) 2016 Duff & Phelps Valuation Handbook. Size premium for companies with market capitalizations between $2.1bn and $3.2bn.
(4) Based on median of 2-year weekly adjusted beta for Solar. 2-year weekly adjusted beta used given Solar spin-off in 2013.
(5) Equity includes adjustment for minority interest.
Cost of
Equity
8.3%
8.5%
8.8%
9.0%
9.3%
9.6%
10.0%
PT Cost
of Debt
4.2%
4.2%
4.2%
4.2%
4.2%
4.2%
4.2%
AT Cost
of Debt
2.8%
2.8%
2.8%
2.8%
2.8%
2.8%
2.8%
Confidential
2.02%
6.03%
0.945
1.49%
0.00%
9.21%
9.21%
2.82%
7.40%
WACC
7.8%
7.7%
7.6%
7.5%
7.4%
7.3%
7.1%
PJT Partners
43View entire presentation