Moelis & Company Investment Banking Pitch Book
Selected Publicly Traded Companies (cont'd)
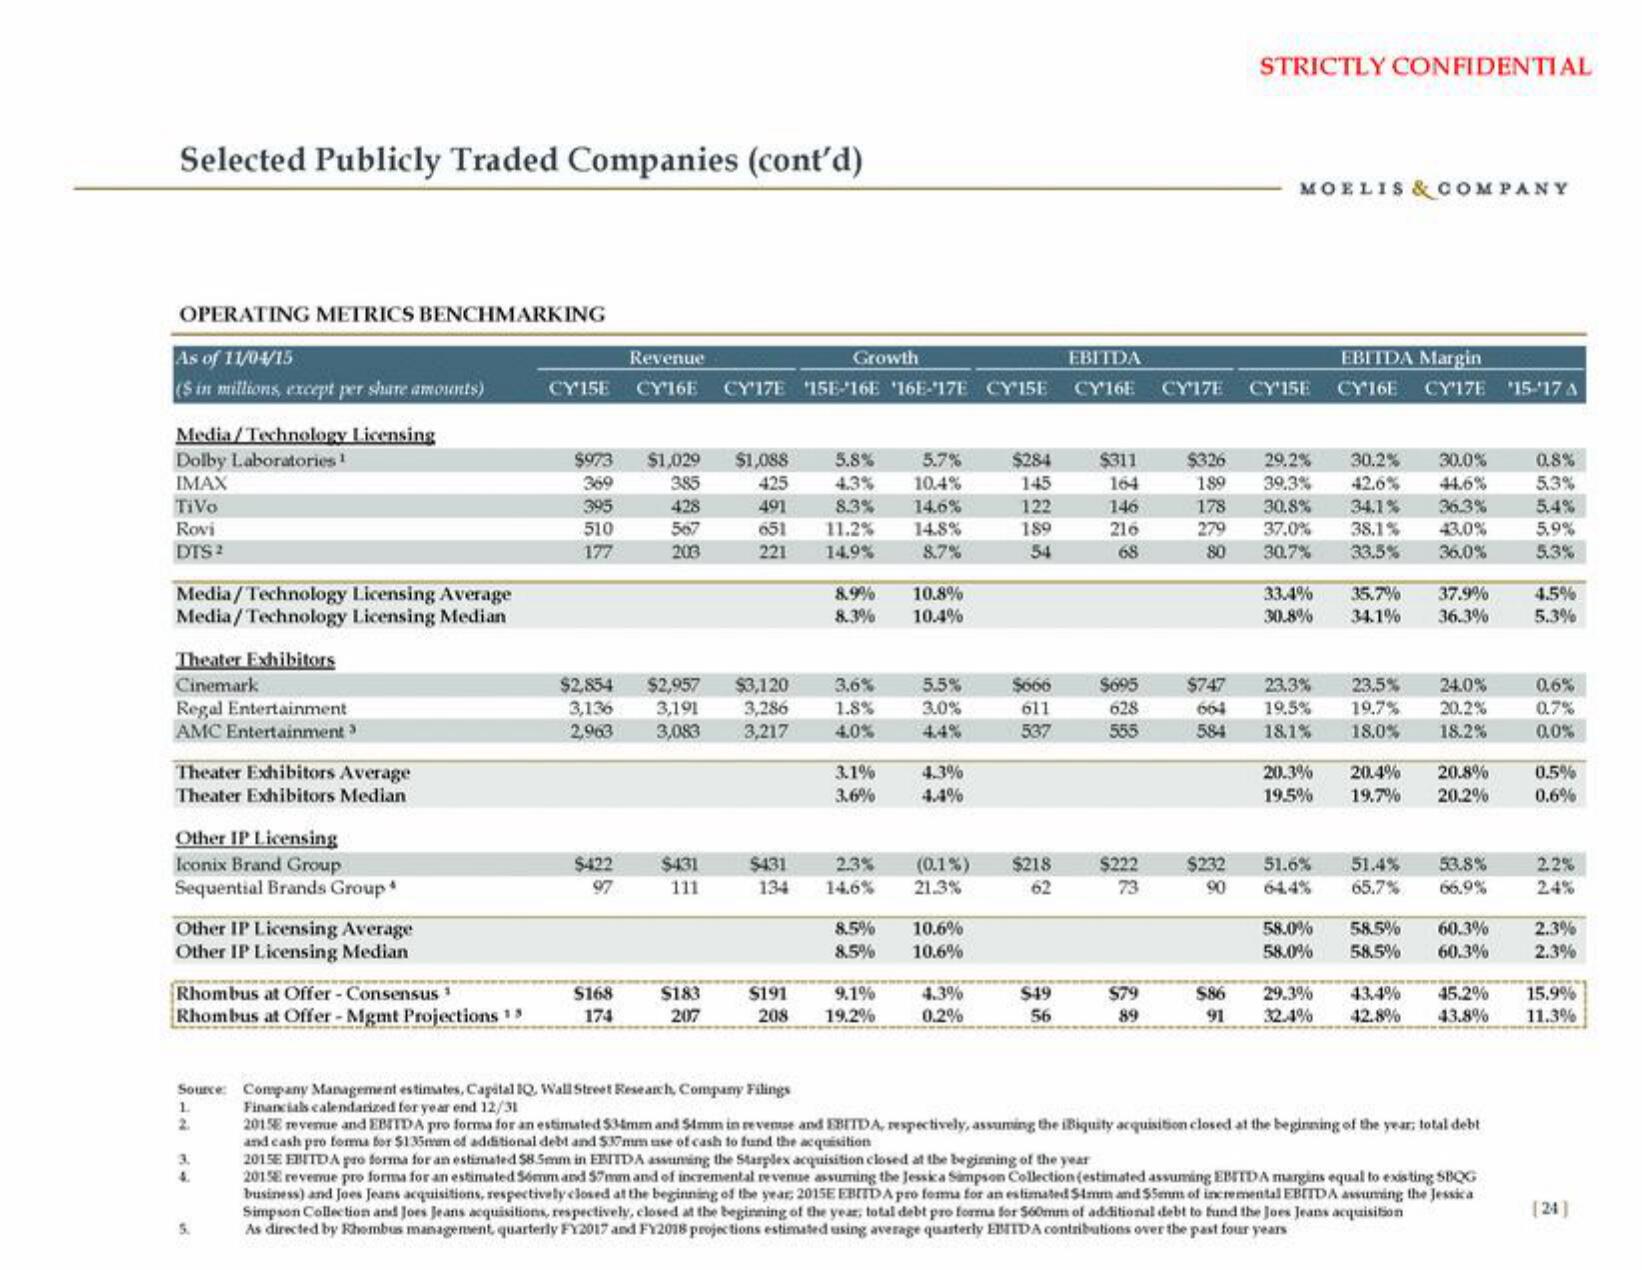
OPERATING METRICS BENCHMARKING
As of 11/04/15
($ in millions, except per share amounts)
Media/Technology Licensing
Dolby Laboratories 1
IMAX
TiVo
Rovi
DTS 2
Media/Technology Licensing Average
Media/Technology Licensing Median
Theater Exhibitors
Cinemark
Regal Entertainment
AMC Entertainment ³
Theater Exhibitors Average
Theater Exhibitors Median
Other IP Licensing
Iconix Brand Group
Sequential Brands Group
Other IP Licensing Average
Other IP Licensing Median
Rhombus at Offer - Consensus
Rhombus at Offer - Mgmt Projections 15
L
2
3.
4.
CY' 15E
5.
$973
369
395
510
177
$422
97
$168
174
Revenue
CY'16E CY'17E 15E-16E 16E-17E CY 15E
$1,029
385
428
567
203
$2,854 $2,957 $3,120
3,136
2,963
3,191 3,286
3,083
3,217
$431
111
$1,088
425
5.8% 5.7%
4.3% 10.4%
8.3% 14.6%
491
651
11.2%
14.8%
8.7%
221 14.9%
$183
207
Growth
$431
134
$191
208
8.9%
8.3%
3.6%
1.8%
4.0%
3.1%
3.6%
2.3%
14.6%
8.5%
8.5%
9.1%
19.2%
10.8%
10.4%
5.5%
3.0%
4.3%
4.4%
10.6%
10.6%
$284
145
122
189
54
(0.1%) $218
21.3%
62
4.3%
0.2%
$666
611
537
$49
56
EBITDA
CY'16E
$311
164
146
216
68
$695
628
555
$222
73
$79
89
STRICTLY CONFIDENTIAL
MOELIS & COMPANY
CY'17E CY'15E
$232
90
$326 29.2%
189 39.3%
178 30.8%
279 37,0% 38.1%
80 30.7%
33.4%
30.8%
$747 23.3%
664
584
20.3%
19.5%
EBITDA Margin
CY'16E CY'17E '15-'17 A
51.6%
30.2%
42.6%
34.1% 36.3%
43.0%
33.5% 36.0%
58.0%
58.0%
19,5% 19.7%
18.1%
18.0%
35.7%
34.1%
30.0%
23.5% 24.0%
20.2%
18.2%
20.4%
19.7%
37.9%
36.3%
20.8%
20.2%
51.4% 53.8%
65.7% 66.9%
Source: Company Management estimates, Capital 1Q, Wall Street Research, Company Filings
Financials calendarized for year end 12/31
2015E revenue and EBITDA pro forma for an estimated 534mm and 54mm in revenue and EBITDA, respectively, assuming the iBiquity acquisition closed at the beginning of the year; total debt
and cash pro forma for $135mm of additional debt and $37mm use of cash to fund the acquisition
2015E EBITDA pro forma for an estimated 58.5mm in EBITDA assuming the Starplex acquisition closed at the beginning of the year
2015E revenue pro forma for an estimated 56mm and 57mm and of incremental revenue assuming the Jessica Simpson Collection (estimated assuming EBITDA margins equal to existing SBQG
business) and Joes Jeans acquisitions, respectively closed at the beginning of the year 2015E EBITDA pro fomma for an estimated $4mm and $5mm of incremental EBITDA assuming the Jessica
Simpson Collection and Joes Jeans acquisitions, respectively, closed at the beginning of the year, total debt pro forma for $60mm of additional debt to fund the Joes Jeans acquisition
As directed by Rhombus management, quarterly FY2017 and FY2018 projections estimated using average quarterly EBITDA contributions over the past four years
58.5% 60.3%
58.5% 60.3%
$86 29.3% 43.4% 45.2%
91 32.4% 42.8% 43.8%
0.8%
5.3%
5,4%
5.9%
5.3%
4.5%
5.3%
0.6%
0.7%
0.0%
0.5%
0.6%
2.2%
24%
2.3%
2.3%
15.9%
11.3%
[24]View entire presentation